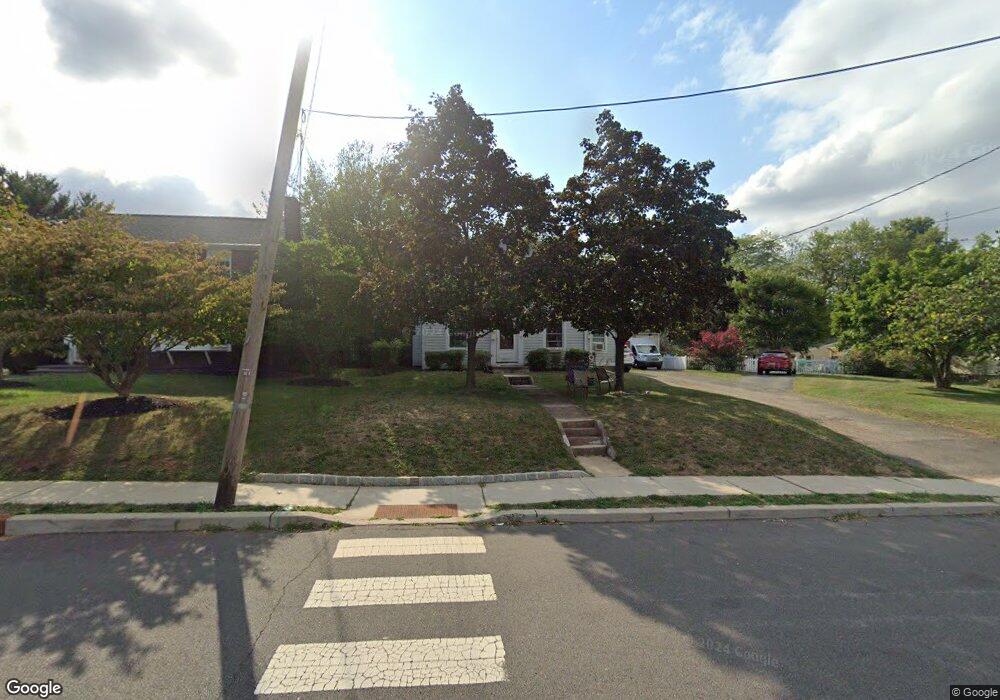
9 Elwood Ave Flemington, NJ 08822
Estimated Value: $365,000 - $482,000
--
Bed
--
Bath
901
Sq Ft
$462/Sq Ft
Est. Value
About This Home
This home is located at 9 Elwood Ave, Flemington, NJ 08822 and is currently estimated at $415,992, approximately $461 per square foot. 9 Elwood Ave is a home located in Hunterdon County with nearby schools including Francis A. Desmares Elementary School, Reading Fleming Intermediate School, and J.P. Case Middle School.
Ownership History
Date
Name
Owned For
Owner Type
Purchase Details
Closed on
Dec 28, 2001
Sold by
Thatcher Christopher L
Bought by
Zavaglia Thomas and Zavaglia Deborah
Current Estimated Value
Home Financials for this Owner
Home Financials are based on the most recent Mortgage that was taken out on this home.
Original Mortgage
$153,600
Outstanding Balance
$62,947
Interest Rate
7.08%
Estimated Equity
$353,045
Purchase Details
Closed on
Oct 30, 1992
Sold by
Day Arthur H and Day Phyllis A
Bought by
Thatcher Christopher L and Thatcher Sharon A
Create a Home Valuation Report for This Property
The Home Valuation Report is an in-depth analysis detailing your home's value as well as a comparison with similar homes in the area
Home Values in the Area
Average Home Value in this Area
Purchase History
| Date | Buyer | Sale Price | Title Company |
|---|---|---|---|
| Zavaglia Thomas | $192,000 | -- | |
| Thatcher Christopher L | $130,500 | -- |
Source: Public Records
Mortgage History
| Date | Status | Borrower | Loan Amount |
|---|---|---|---|
| Open | Zavaglia Thomas | $153,600 |
Source: Public Records
Tax History Compared to Growth
Tax History
| Year | Tax Paid | Tax Assessment Tax Assessment Total Assessment is a certain percentage of the fair market value that is determined by local assessors to be the total taxable value of land and additions on the property. | Land | Improvement |
|---|---|---|---|---|
| 2025 | $7,583 | $288,800 | $115,800 | $173,000 |
| 2024 | $7,317 | $269,300 | $107,200 | $162,100 |
| 2023 | $7,317 | $252,300 | $100,100 | $152,200 |
| 2022 | $6,297 | $209,000 | $92,800 | $116,200 |
| 2021 | $6,055 | $199,500 | $87,600 | $111,900 |
| 2020 | $6,257 | $196,900 | $87,600 | $109,300 |
| 2019 | $6,055 | $194,700 | $86,300 | $108,400 |
| 2018 | $5,880 | $192,100 | $84,600 | $107,500 |
| 2017 | $5,820 | $188,600 | $84,600 | $104,000 |
| 2016 | $5,840 | $186,000 | $84,600 | $101,400 |
| 2015 | $5,601 | $183,400 | $84,600 | $98,800 |
| 2014 | $5,365 | $180,700 | $84,600 | $96,100 |
Source: Public Records
Map
Nearby Homes
- 92 Park Ave
- 12 Corcoran St
- 81 Elwood Ave
- 5 William Martin Way Unit 5
- 25 Haddenford Dr
- 29 Royal Rd
- 110 Mine St
- 402 Clark Cir
- 803 Yorkshire Dr
- 100 State Route 12
- 603 Nottingham Way
- 807 Wedgewood Cir
- 63 Jefferson Ct
- 31 Hancock Ct
- 106 Franklin Ct Unit 238
- 107 Provincetown Ct
- 17 Londonderry Dr
- 208 Blackberry Ct
- 15 Colts Ln
- 1201 Southard Ct