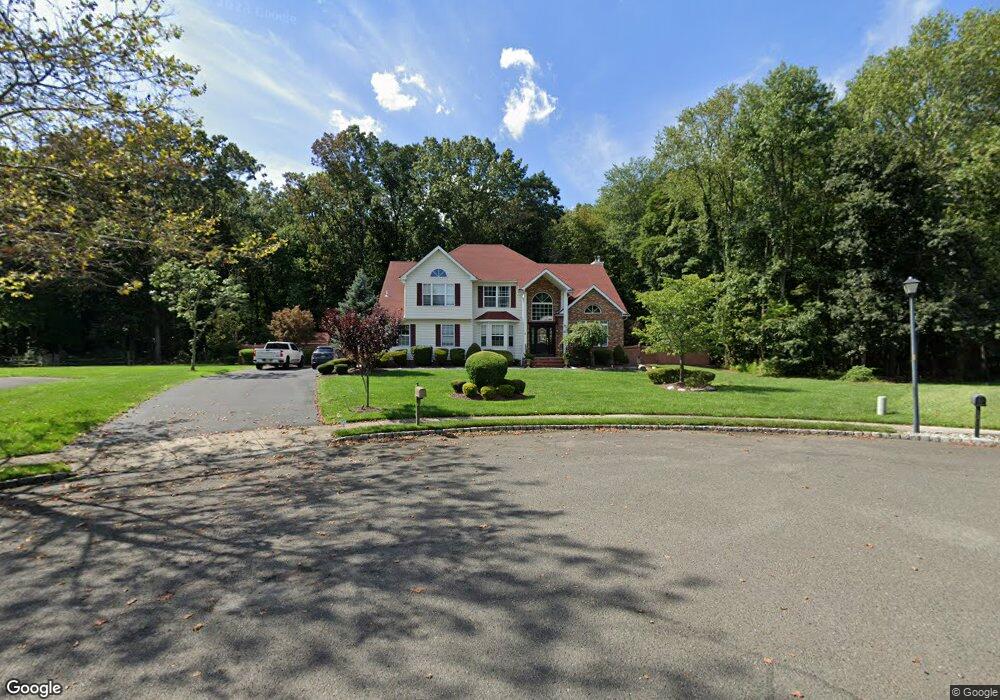
9 Erin Ct Trenton, NJ 08691
Estimated Value: $969,000 - $1,040,000
4
Beds
4
Baths
2,575
Sq Ft
$387/Sq Ft
Est. Value
About This Home
This home is located at 9 Erin Ct, Trenton, NJ 08691 and is currently estimated at $996,345, approximately $386 per square foot. 9 Erin Ct is a home located in Mercer County with nearby schools including Sharon Elementary School, Pond Road Middle School, and Robbinsville High School.
Ownership History
Date
Name
Owned For
Owner Type
Purchase Details
Closed on
Apr 18, 2022
Sold by
Previl Henry E and Previl Maria E
Bought by
Previl Henry
Current Estimated Value
Purchase Details
Closed on
Jul 28, 2009
Sold by
Packard Kenneth J and Packard Diane E
Bought by
Previl Henry and Previl Maria E
Home Financials for this Owner
Home Financials are based on the most recent Mortgage that was taken out on this home.
Original Mortgage
$424,195
Interest Rate
5.43%
Mortgage Type
FHA
Purchase Details
Closed on
May 28, 1997
Sold by
Washington Estates Inc
Bought by
Packard Kenneth and Packard Diane
Home Financials for this Owner
Home Financials are based on the most recent Mortgage that was taken out on this home.
Original Mortgage
$213,000
Interest Rate
7.98%
Mortgage Type
Purchase Money Mortgage
Create a Home Valuation Report for This Property
The Home Valuation Report is an in-depth analysis detailing your home's value as well as a comparison with similar homes in the area
Home Values in the Area
Average Home Value in this Area
Purchase History
| Date | Buyer | Sale Price | Title Company |
|---|---|---|---|
| Previl Henry | -- | None Listed On Document | |
| Previl Henry | $529,900 | Foundation Title Llc | |
| Packard Kenneth | $267,150 | -- |
Source: Public Records
Mortgage History
| Date | Status | Borrower | Loan Amount |
|---|---|---|---|
| Previous Owner | Previl Henry | $424,195 | |
| Previous Owner | Packard Kenneth | $213,000 |
Source: Public Records
Tax History Compared to Growth
Tax History
| Year | Tax Paid | Tax Assessment Tax Assessment Total Assessment is a certain percentage of the fair market value that is determined by local assessors to be the total taxable value of land and additions on the property. | Land | Improvement |
|---|---|---|---|---|
| 2025 | $18,064 | $540,500 | $259,600 | $280,900 |
| 2024 | $16,858 | $540,500 | $259,600 | $280,900 |
| 2023 | $16,858 | $540,500 | $259,600 | $280,900 |
| 2022 | $16,204 | $540,500 | $259,600 | $280,900 |
| 2021 | $15,972 | $540,500 | $259,600 | $280,900 |
| 2020 | $15,977 | $540,500 | $259,600 | $280,900 |
| 2019 | $15,983 | $540,500 | $259,600 | $280,900 |
| 2018 | $15,880 | $540,500 | $259,600 | $280,900 |
| 2017 | $15,847 | $540,500 | $259,600 | $280,900 |
| 2016 | $15,702 | $540,500 | $259,600 | $280,900 |
| 2015 | $15,464 | $540,500 | $259,600 | $280,900 |
| 2014 | $15,518 | $540,500 | $259,600 | $280,900 |
Source: Public Records
Map
Nearby Homes
- 179 Robbinsville Edinburg Rd
- 94 Tindall Rd
- 260 Gordon Rd
- 45 Bennet Field Way
- 51 Bennet Field Way
- Hampton Plan at Preston Pointe
- 47 Bennet Field Way
- 32 Bennet Field Way
- 43 Bennet Field Way
- 49 Bennet Field Way
- 38 Bennet Field Way
- Chadwick Plan at Preston Pointe
- 55 Bennet Field Way
- 57 Bennet Field Way
- 7 Beacon Ct
- 28 Stanwyck Ct
- 23 N Main St
- 7 Anderson Ln
- 1305 1325 Route 130
- 5 Dunston Ln