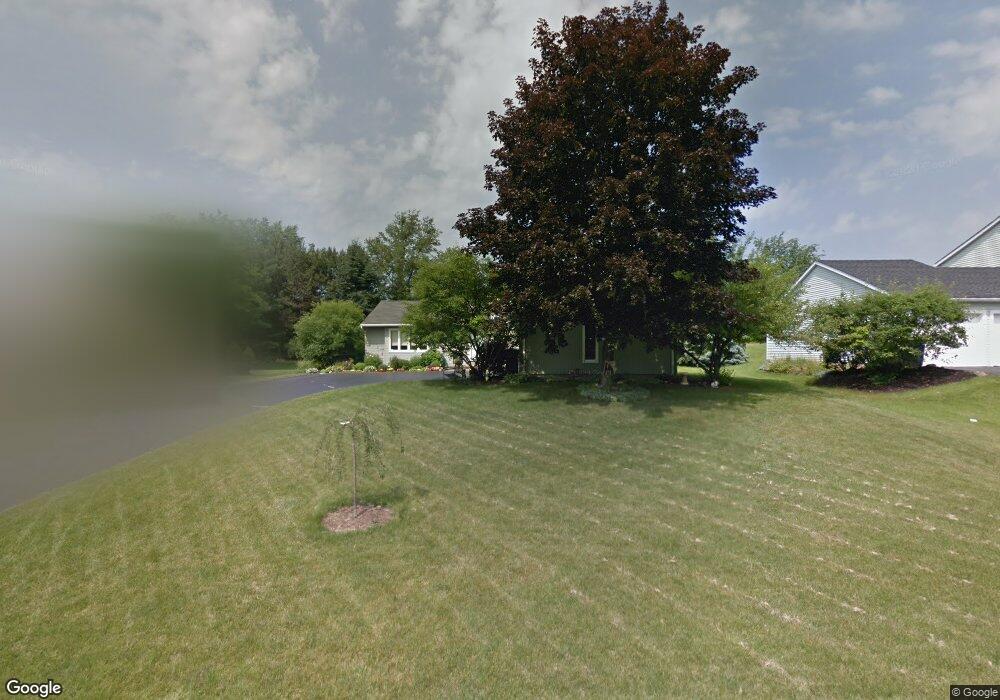
9 Falling Brook Rd Fairport, NY 14450
Estimated Value: $407,635 - $461,000
4
Beds
3
Baths
2,160
Sq Ft
$199/Sq Ft
Est. Value
About This Home
This home is located at 9 Falling Brook Rd, Fairport, NY 14450 and is currently estimated at $429,659, approximately $198 per square foot. 9 Falling Brook Rd is a home located in Monroe County with nearby schools including Dudley School, Northside School, and Martha Brown Middle School.
Ownership History
Date
Name
Owned For
Owner Type
Purchase Details
Closed on
Mar 24, 2009
Sold by
Reiber George
Bought by
Menna Christopher
Current Estimated Value
Home Financials for this Owner
Home Financials are based on the most recent Mortgage that was taken out on this home.
Original Mortgage
$172,600
Outstanding Balance
$107,596
Interest Rate
5.25%
Mortgage Type
New Conventional
Estimated Equity
$322,063
Purchase Details
Closed on
Jul 21, 2002
Sold by
Eaton Rodney E
Bought by
Reiber George M
Purchase Details
Closed on
Oct 31, 2000
Sold by
Ventura Joseph S
Bought by
Eaton Rodney E
Purchase Details
Closed on
Aug 7, 2000
Sold by
The Bank Of New York
Bought by
Ventura Joseph S
Purchase Details
Closed on
May 11, 2000
Sold by
Napier Esq Robert Referee
Bought by
The Bank Of New York
Purchase Details
Closed on
Feb 27, 1997
Create a Home Valuation Report for This Property
The Home Valuation Report is an in-depth analysis detailing your home's value as well as a comparison with similar homes in the area
Home Values in the Area
Average Home Value in this Area
Purchase History
| Date | Buyer | Sale Price | Title Company |
|---|---|---|---|
| Menna Christopher | $188,000 | Maureen Garvey | |
| Reiber George M | $158,000 | -- | |
| Eaton Rodney E | $150,000 | Derek Brocklebank | |
| Ventura Joseph S | $91,000 | -- | |
| The Bank Of New York | $94,981 | Steven Einig | |
| -- | -- | -- |
Source: Public Records
Mortgage History
| Date | Status | Borrower | Loan Amount |
|---|---|---|---|
| Open | Menna Christopher | $172,600 |
Source: Public Records
Tax History
| Year | Tax Paid | Tax Assessment Tax Assessment Total Assessment is a certain percentage of the fair market value that is determined by local assessors to be the total taxable value of land and additions on the property. | Land | Improvement |
|---|---|---|---|---|
| 2025 | $7,537 | $204,800 | $60,600 | $144,200 |
| 2024 | $7,537 | $204,800 | $60,600 | $144,200 |
| 2023 | $7,228 | $204,800 | $60,600 | $144,200 |
| 2022 | $7,600 | $204,800 | $60,600 | $144,200 |
| 2021 | $7,579 | $204,800 | $60,600 | $144,200 |
| 2020 | $6,736 | $204,800 | $60,600 | $144,200 |
| 2019 | $6,193 | $204,800 | $60,600 | $144,200 |
| 2018 | $6,514 | $204,800 | $60,600 | $144,200 |
| 2017 | $3,826 | $189,600 | $60,600 | $129,000 |
| 2016 | $6,193 | $189,600 | $60,600 | $129,000 |
| 2015 | -- | $189,600 | $60,600 | $129,000 |
| 2014 | -- | $189,600 | $60,600 | $129,000 |
Source: Public Records
Map
Nearby Homes
- 11 Canton Meadow
- 15 Hampton Ln
- 16 Pebble Hill Rd
- 3 Freshfield Rise
- 14 Port Meadow Trail
- 15 Matthew Dr
- 10 Margo Dr
- 26 Misty Pine Rd
- 16 Bent Oak Trail
- 85 Clarkes Crossing
- 20 Brandywine Ln
- 1 Chenin Run
- 95 Summit St
- 38 Huxley Way
- 8 Arbor Ct
- 1889 Turk Hill Rd
- 335 Mason Rd
- 18 Eagle Hollow
- 6 Eagle Hollow
- 60 Chenin Run
- 7 Falling Brook Rd
- 11 Falling Brook Rd
- 5 Falling Brook Rd
- 15 Falling Brook Rd
- 10 Falling Brook Rd
- 8 Falling Brook Rd
- 3 Falling Brook Rd
- 16 Falling Brook Rd
- 17 Falling Brook Rd
- 6 Falling Brook Rd
- 19 Falling Brook Rd
- 4 Falling Brook Rd
- 20 Falling Brook Rd
- 1 Falling Brook Rd
- 2 Falling Brook Rd
- 21 Falling Brook Rd
- 22 Falling Brook Rd
- 24 Teakwood Ln
- 2 Teakwood Ln
- 1179 Ayrault Rd
Your Personal Tour Guide
Ask me questions while you tour the home.