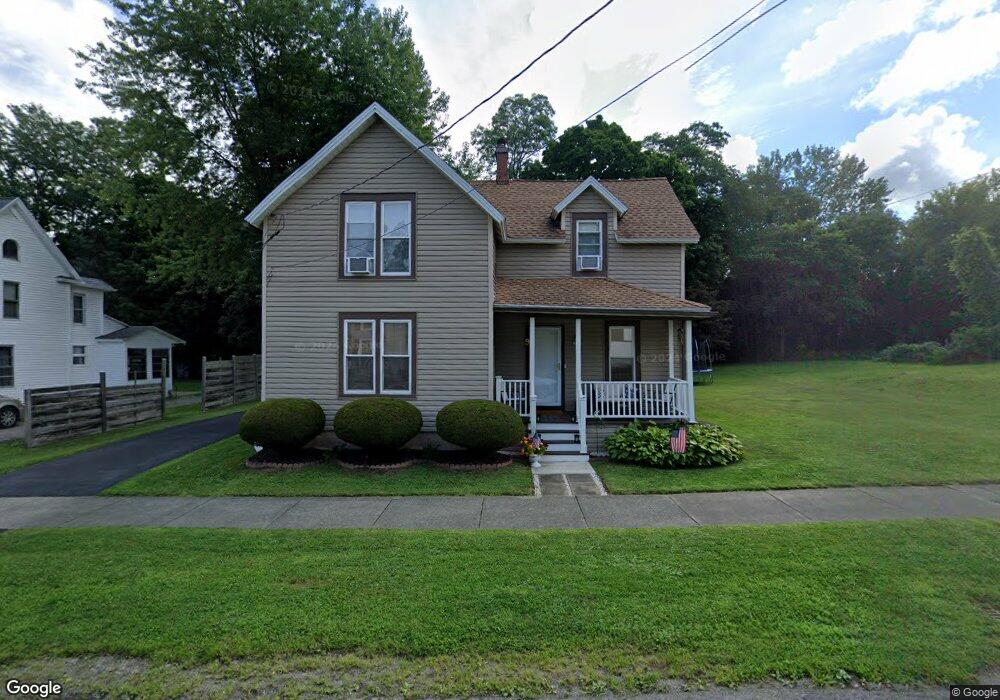
9 Fay St Brocton, NY 14716
Estimated Value: $146,000 - $166,000
3
Beds
1
Bath
1,638
Sq Ft
$93/Sq Ft
Est. Value
About This Home
This home is located at 9 Fay St, Brocton, NY 14716 and is currently estimated at $152,564, approximately $93 per square foot. 9 Fay St is a home located in Chautauqua County with nearby schools including Brocton Elementary School, Brocton Middle/High School, and Lake Erie Baptist Church Academy.
Ownership History
Date
Name
Owned For
Owner Type
Purchase Details
Closed on
Jul 31, 2009
Sold by
Cook Gene P
Bought by
Andrews David A
Current Estimated Value
Home Financials for this Owner
Home Financials are based on the most recent Mortgage that was taken out on this home.
Original Mortgage
$86,734
Outstanding Balance
$57,182
Interest Rate
5.43%
Mortgage Type
Purchase Money Mortgage
Estimated Equity
$95,382
Purchase Details
Closed on
Sep 29, 1994
Sold by
Przytula Lucinda A
Bought by
Cook Gene P and Cook Kim M
Create a Home Valuation Report for This Property
The Home Valuation Report is an in-depth analysis detailing your home's value as well as a comparison with similar homes in the area
Home Values in the Area
Average Home Value in this Area
Purchase History
| Date | Buyer | Sale Price | Title Company |
|---|---|---|---|
| Andrews David A | $84,000 | David R Stapleton | |
| Cook Gene P | $48,000 | -- |
Source: Public Records
Mortgage History
| Date | Status | Borrower | Loan Amount |
|---|---|---|---|
| Open | Andrews David A | $86,734 |
Source: Public Records
Tax History Compared to Growth
Tax History
| Year | Tax Paid | Tax Assessment Tax Assessment Total Assessment is a certain percentage of the fair market value that is determined by local assessors to be the total taxable value of land and additions on the property. | Land | Improvement |
|---|---|---|---|---|
| 2024 | $3,391 | $42,000 | $6,500 | $35,500 |
| 2023 | $3,331 | $42,000 | $6,500 | $35,500 |
| 2022 | $3,293 | $42,000 | $6,500 | $35,500 |
| 2021 | $3,261 | $42,000 | $6,500 | $35,500 |
| 2020 | $2,439 | $42,000 | $6,500 | $35,500 |
| 2019 | $2,428 | $42,000 | $6,500 | $35,500 |
| 2018 | $2,428 | $42,000 | $6,500 | $35,500 |
| 2017 | $2,321 | $41,000 | $6,500 | $34,500 |
| 2016 | $2,306 | $41,000 | $6,500 | $34,500 |
| 2015 | -- | $41,000 | $6,500 | $34,500 |
| 2014 | -- | $41,000 | $6,500 | $34,500 |
Source: Public Records
Map
Nearby Homes