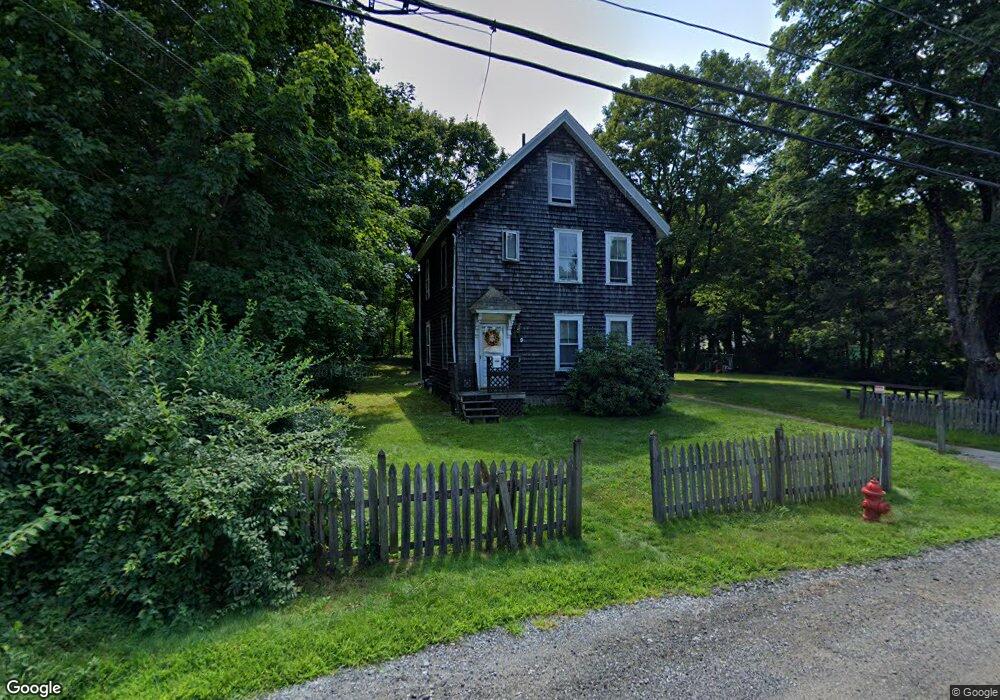
9 Felch Rd Natick, MA 01760
Estimated Value: $752,539 - $960,000
3
Beds
2
Baths
1,848
Sq Ft
$465/Sq Ft
Est. Value
About This Home
This home is located at 9 Felch Rd, Natick, MA 01760 and is currently estimated at $859,135, approximately $464 per square foot. 9 Felch Rd is a home located in Middlesex County with nearby schools including Natick High School, Bennett-Hemenway (Ben-Hem) Elementary School, and Wilson Middle School.
Ownership History
Date
Name
Owned For
Owner Type
Purchase Details
Closed on
Jan 20, 2024
Sold by
Mcgovern Carol A
Bought by
Mcgovern Ft and Mcgovern
Current Estimated Value
Purchase Details
Closed on
Apr 1, 2004
Sold by
Glawson Carol A and Glawson Donald C
Bought by
Glawson Carol A and Mcgovern Carol A
Create a Home Valuation Report for This Property
The Home Valuation Report is an in-depth analysis detailing your home's value as well as a comparison with similar homes in the area
Home Values in the Area
Average Home Value in this Area
Purchase History
| Date | Buyer | Sale Price | Title Company |
|---|---|---|---|
| Mcgovern Ft | -- | None Available | |
| Glawson Carol A | -- | -- |
Source: Public Records
Tax History Compared to Growth
Tax History
| Year | Tax Paid | Tax Assessment Tax Assessment Total Assessment is a certain percentage of the fair market value that is determined by local assessors to be the total taxable value of land and additions on the property. | Land | Improvement |
|---|---|---|---|---|
| 2025 | $6,812 | $569,600 | $455,000 | $114,600 |
| 2024 | $6,573 | $536,100 | $428,200 | $107,900 |
| 2023 | $6,448 | $510,100 | $409,400 | $100,700 |
| 2022 | $6,160 | $461,800 | $369,700 | $92,100 |
| 2021 | $6,145 | $451,500 | $348,600 | $102,900 |
| 2020 | $6,163 | $452,800 | $332,800 | $120,000 |
| 2019 | $6,519 | $452,800 | $332,800 | $120,000 |
| 2018 | $5,438 | $416,700 | $316,900 | $99,800 |
| 2017 | $5,458 | $404,600 | $276,200 | $128,400 |
| 2016 | $5,191 | $382,500 | $255,200 | $127,300 |
| 2015 | $5,148 | $372,500 | $255,200 | $117,300 |
Source: Public Records
Map
Nearby Homes