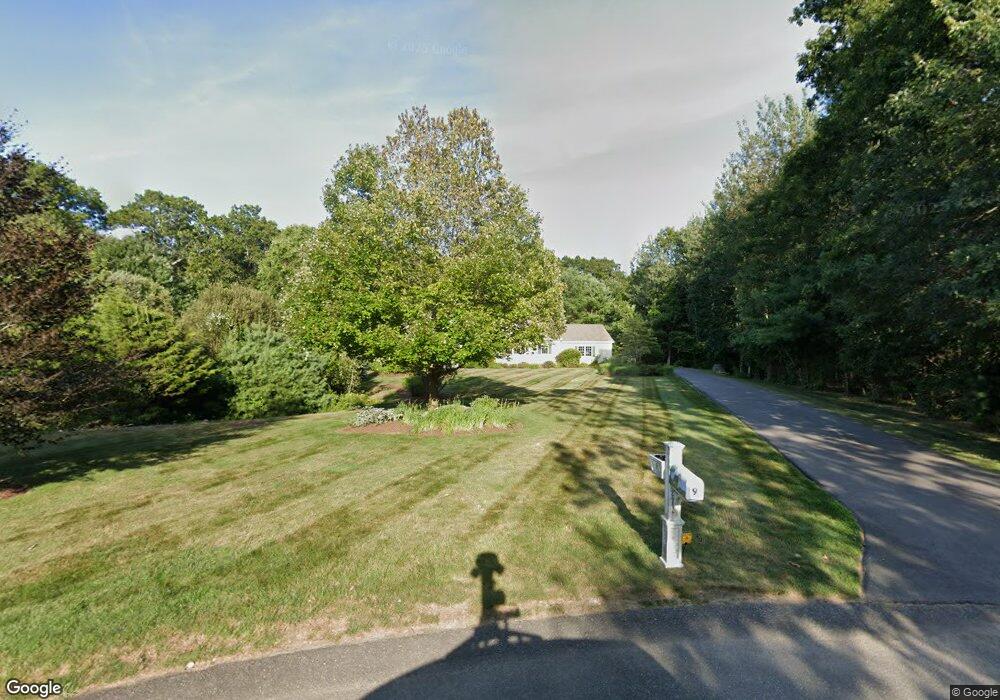
9 Franlee Dr Rehoboth, MA 02769
Estimated Value: $789,851 - $930,000
3
Beds
2
Baths
2,300
Sq Ft
$374/Sq Ft
Est. Value
About This Home
This home is located at 9 Franlee Dr, Rehoboth, MA 02769 and is currently estimated at $860,463, approximately $374 per square foot. 9 Franlee Dr is a home located in Bristol County with nearby schools including Dighton-Rehoboth Regional High School, Grace Baptist Christian Academy, and The Pinecroft School.
Ownership History
Date
Name
Owned For
Owner Type
Purchase Details
Closed on
Nov 2, 2009
Sold by
Najas Realty Llc
Bought by
Eskelund Peter M and Eskelund Jan E
Current Estimated Value
Home Financials for this Owner
Home Financials are based on the most recent Mortgage that was taken out on this home.
Original Mortgage
$407,600
Outstanding Balance
$266,962
Interest Rate
5.06%
Mortgage Type
Purchase Money Mortgage
Estimated Equity
$593,501
Purchase Details
Closed on
Nov 24, 2008
Sold by
Sauzeer Properties Llc
Bought by
Najas Realty Llc
Create a Home Valuation Report for This Property
The Home Valuation Report is an in-depth analysis detailing your home's value as well as a comparison with similar homes in the area
Home Values in the Area
Average Home Value in this Area
Purchase History
| Date | Buyer | Sale Price | Title Company |
|---|---|---|---|
| Eskelund Peter M | $509,500 | -- | |
| Najas Realty Llc | $165,000 | -- |
Source: Public Records
Mortgage History
| Date | Status | Borrower | Loan Amount |
|---|---|---|---|
| Open | Eskelund Peter M | $407,600 |
Source: Public Records
Tax History Compared to Growth
Tax History
| Year | Tax Paid | Tax Assessment Tax Assessment Total Assessment is a certain percentage of the fair market value that is determined by local assessors to be the total taxable value of land and additions on the property. | Land | Improvement |
|---|---|---|---|---|
| 2025 | $86 | $771,800 | $172,800 | $599,000 |
| 2024 | $8,718 | $767,400 | $207,400 | $560,000 |
| 2023 | $8,435 | $728,400 | $203,000 | $525,400 |
| 2022 | $8,037 | $634,300 | $186,100 | $448,200 |
| 2021 | $3,684 | $598,600 | $169,500 | $429,100 |
| 2020 | $3,712 | $573,600 | $177,500 | $396,100 |
| 2018 | $3,397 | $567,800 | $169,000 | $398,800 |
| 2017 | $6,031 | $480,200 | $169,000 | $311,200 |
| 2016 | $6,045 | $497,500 | $176,600 | $320,900 |
| 2015 | $5,556 | $451,300 | $168,400 | $282,900 |
| 2014 | $5,511 | $443,000 | $160,100 | $282,900 |
Source: Public Records
Map
Nearby Homes
- 99 Brigham Hill Rd
- 240 Smith St
- 30 Michael Rd
- 8 Kasmira Way
- 2 Round Farm Rd
- 1 Round Farm Rd
- 48 Round Farm Rd
- 58 Peck St
- 14 Tremont St
- 4 Colonial Dr Unit 4
- 45 Spruce Ln
- 8 Preservation Way
- 3 Wilmarth St
- 730 Pike Ave
- 73 Butterworth Dr
- 29 & 43 Francis St
- 84 Fairview Ave
- 27 Run Brook Cir
- 127 John Scott Blvd
- 125 John Scott Blvd