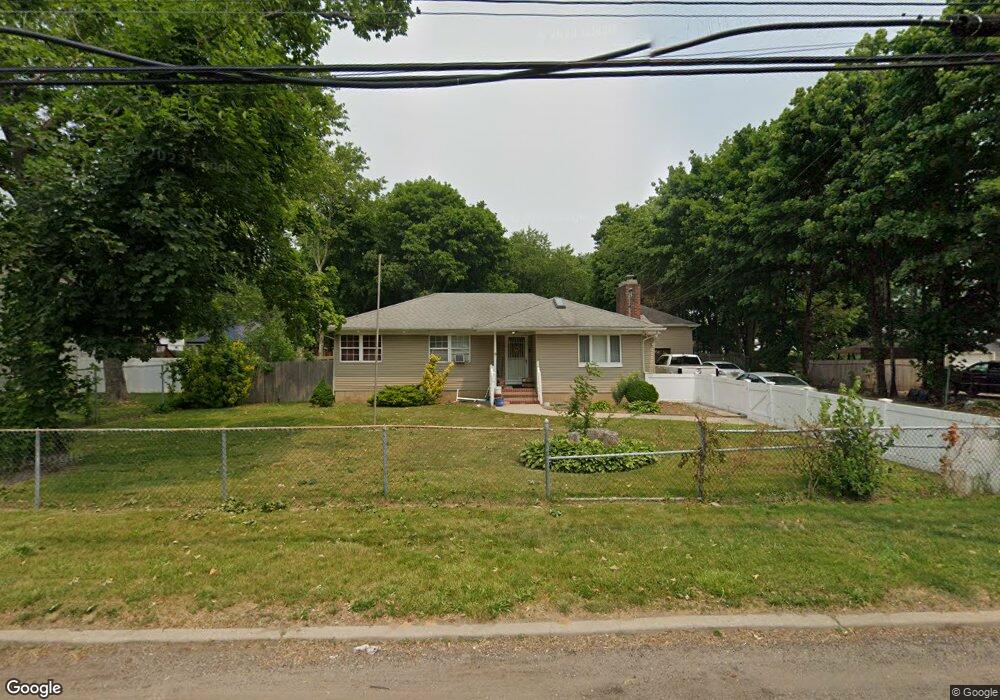
9 Fulton St Brentwood, NY 11717
Estimated Value: $543,533 - $668,000
--
Bed
--
Bath
--
Sq Ft
0.45
Acres
About This Home
This home is located at 9 Fulton St, Brentwood, NY 11717 and is currently estimated at $605,633. 9 Fulton St is a home located in Suffolk County with nearby schools including MDQ Academy.
Ownership History
Date
Name
Owned For
Owner Type
Purchase Details
Closed on
Apr 23, 2003
Sold by
Virella Elsie
Bought by
Vasquez Sandro
Current Estimated Value
Home Financials for this Owner
Home Financials are based on the most recent Mortgage that was taken out on this home.
Original Mortgage
$210,338
Outstanding Balance
$91,089
Interest Rate
5.86%
Mortgage Type
FHA
Estimated Equity
$514,544
Purchase Details
Closed on
May 10, 2002
Sold by
Spellman Coby L
Bought by
Virella Elsie
Purchase Details
Closed on
Nov 24, 1997
Sold by
Tristate Capital Corp
Bought by
Virella Elsie and Spellman Coby L
Purchase Details
Closed on
Nov 3, 1997
Sold by
Middlemiss Esq John F
Bought by
Tristate Capital Corp
Purchase Details
Closed on
Jan 31, 1996
Sold by
Governale Carl and Barrasso Anthony
Bought by
Roy David H and Roy Elaine L
Create a Home Valuation Report for This Property
The Home Valuation Report is an in-depth analysis detailing your home's value as well as a comparison with similar homes in the area
Home Values in the Area
Average Home Value in this Area
Purchase History
| Date | Buyer | Sale Price | Title Company |
|---|---|---|---|
| Vasquez Sandro | $212,000 | Fidelity National Title Ins | |
| Virella Elsie | $3,000 | -- | |
| Virella Elsie | $113,500 | Custom Title Services Inc | |
| Tristate Capital Corp | $78,000 | Custom Title Services Inc | |
| Roy David H | $40,000 | Chicago Title Insurance Co |
Source: Public Records
Mortgage History
| Date | Status | Borrower | Loan Amount |
|---|---|---|---|
| Open | Vasquez Sandro | $210,338 |
Source: Public Records
Tax History Compared to Growth
Tax History
| Year | Tax Paid | Tax Assessment Tax Assessment Total Assessment is a certain percentage of the fair market value that is determined by local assessors to be the total taxable value of land and additions on the property. | Land | Improvement |
|---|---|---|---|---|
| 2024 | $8,707 | $35,700 | $9,400 | $26,300 |
| 2023 | $8,707 | $35,700 | $9,400 | $26,300 |
| 2022 | $7,292 | $35,700 | $9,400 | $26,300 |
| 2021 | $7,292 | $35,700 | $9,400 | $26,300 |
| 2020 | $7,902 | $35,700 | $9,400 | $26,300 |
| 2019 | $7,902 | $0 | $0 | $0 |
| 2018 | -- | $35,700 | $9,400 | $26,300 |
| 2017 | $7,349 | $35,700 | $9,400 | $26,300 |
| 2016 | $7,247 | $35,700 | $9,400 | $26,300 |
| 2015 | -- | $35,700 | $9,400 | $26,300 |
| 2014 | -- | $35,700 | $9,400 | $26,300 |
Source: Public Records
Map
Nearby Homes