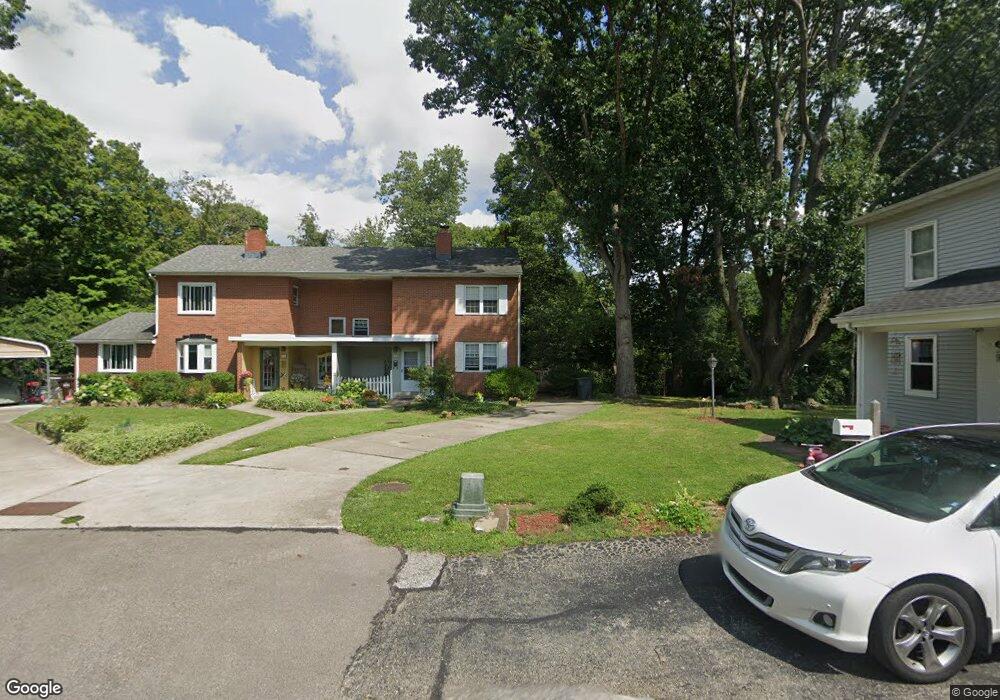
9 Funston Ln Cincinnati, OH 45218
Estimated Value: $172,000 - $194,000
3
Beds
1
Bath
1,280
Sq Ft
$143/Sq Ft
Est. Value
About This Home
This home is located at 9 Funston Ln, Cincinnati, OH 45218 and is currently estimated at $183,060, approximately $143 per square foot. 9 Funston Ln is a home located in Hamilton County with nearby schools including Central Montessori Academy and John Paul II Catholic School.
Ownership History
Date
Name
Owned For
Owner Type
Purchase Details
Closed on
Mar 31, 2022
Sold by
Huff Martin B and Huff Joyce E
Bought by
Kinney Catherine A
Current Estimated Value
Home Financials for this Owner
Home Financials are based on the most recent Mortgage that was taken out on this home.
Original Mortgage
$105,000
Outstanding Balance
$98,421
Interest Rate
4.67%
Mortgage Type
New Conventional
Estimated Equity
$84,639
Purchase Details
Closed on
Feb 16, 1996
Sold by
Zaenkert Fred A
Bought by
Huff Martin B and Huff Joyce E
Home Financials for this Owner
Home Financials are based on the most recent Mortgage that was taken out on this home.
Original Mortgage
$33,800
Interest Rate
7.16%
Create a Home Valuation Report for This Property
The Home Valuation Report is an in-depth analysis detailing your home's value as well as a comparison with similar homes in the area
Home Values in the Area
Average Home Value in this Area
Purchase History
| Date | Buyer | Sale Price | Title Company |
|---|---|---|---|
| Kinney Catherine A | $150,000 | Prodigy Title | |
| Huff Martin B | -- | -- |
Source: Public Records
Mortgage History
| Date | Status | Borrower | Loan Amount |
|---|---|---|---|
| Open | Kinney Catherine A | $105,000 | |
| Previous Owner | Huff Martin B | $33,800 |
Source: Public Records
Tax History
| Year | Tax Paid | Tax Assessment Tax Assessment Total Assessment is a certain percentage of the fair market value that is determined by local assessors to be the total taxable value of land and additions on the property. | Land | Improvement |
|---|---|---|---|---|
| 2025 | $3,766 | $52,500 | $10,255 | $42,245 |
| 2023 | $3,249 | $52,500 | $10,255 | $42,245 |
| 2022 | $2,318 | $26,958 | $8,558 | $18,400 |
| 2021 | $2,318 | $26,958 | $8,558 | $18,400 |
| 2020 | $2,292 | $26,958 | $8,558 | $18,400 |
| 2019 | $2,240 | $23,041 | $7,315 | $15,726 |
| 2018 | $2,243 | $23,041 | $7,315 | $15,726 |
| 2017 | $2,111 | $23,041 | $7,315 | $15,726 |
| 2016 | $2,540 | $26,824 | $8,148 | $18,676 |
| 2015 | $2,359 | $26,824 | $8,148 | $18,676 |
| 2014 | $2,410 | $26,824 | $8,148 | $18,676 |
| 2013 | $2,420 | $27,654 | $8,400 | $19,254 |
Source: Public Records
Map
Nearby Homes
- 31 Flanders Ln
- 34 Gambier Cir
- 6 Chalmers Ct
- 11 Ashby St
- 1 Jennings Rd
- 65 Drummond St
- 16 Japonica Dr
- 6 Belknap Place 1
- 11 Dewitt Ct
- 9 Dewitt Ct
- 7 Dewitt Ct
- 29 Dayspring Terrace
- 48 Damon Rd
- 23 Briarwood Ln
- 10766 Chelmsford Rd
- 10022 Lakeside Dr
- 564 Waycross Rd
- 10833 Blackburn Ct Unit 35
- 10831 Blackburn Ct
- 10833 Blackburn Ct
Your Personal Tour Guide
Ask me questions while you tour the home.