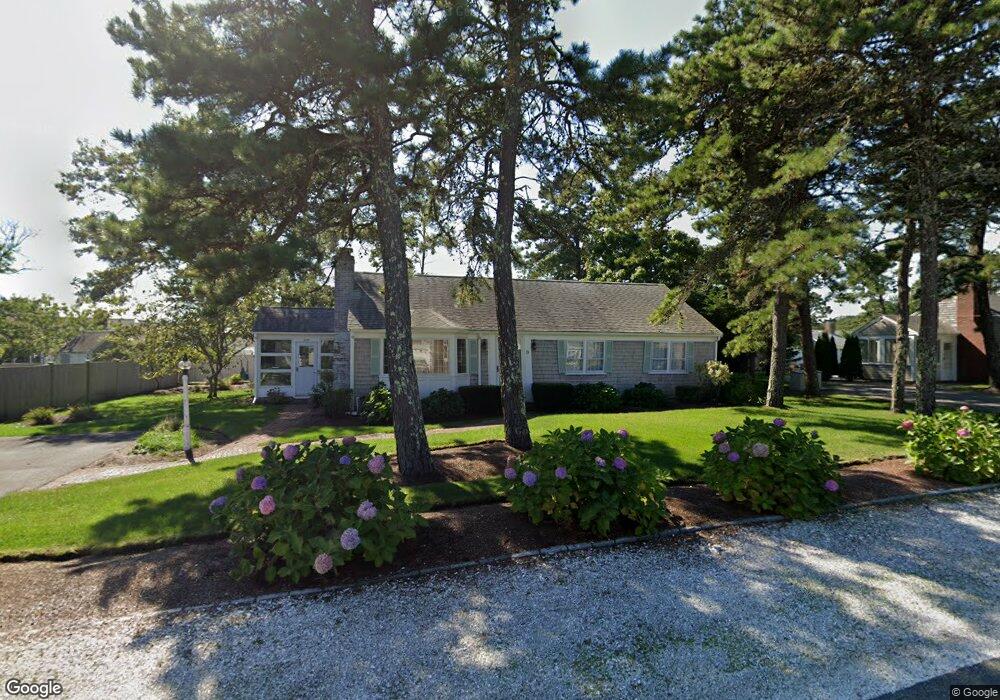
9 Garfield Ln West Dennis, MA 02670
West Dennis NeighborhoodEstimated Value: $1,122,125 - $1,207,000
3
Beds
2
Baths
1,274
Sq Ft
$899/Sq Ft
Est. Value
About This Home
This home is located at 9 Garfield Ln, West Dennis, MA 02670 and is currently estimated at $1,145,781, approximately $899 per square foot. 9 Garfield Ln is a home located in Barnstable County with nearby schools including Dennis-Yarmouth Regional High School.
Ownership History
Date
Name
Owned For
Owner Type
Purchase Details
Closed on
Sep 6, 2013
Sold by
Ryan Scott J and Ryan Susan A
Bought by
Kane Michael J
Current Estimated Value
Home Financials for this Owner
Home Financials are based on the most recent Mortgage that was taken out on this home.
Original Mortgage
$223,500
Outstanding Balance
$166,386
Interest Rate
4.34%
Mortgage Type
New Conventional
Estimated Equity
$979,395
Purchase Details
Closed on
Jul 20, 2006
Sold by
Morin Susan J
Bought by
Ryan Scott J and Ryan Susan A
Home Financials for this Owner
Home Financials are based on the most recent Mortgage that was taken out on this home.
Original Mortgage
$375,000
Interest Rate
6.67%
Mortgage Type
Purchase Money Mortgage
Purchase Details
Closed on
Nov 13, 1996
Sold by
Anderson Carol M and Anderson Carol G
Bought by
Morin Susna J
Create a Home Valuation Report for This Property
The Home Valuation Report is an in-depth analysis detailing your home's value as well as a comparison with similar homes in the area
Home Values in the Area
Average Home Value in this Area
Purchase History
| Date | Buyer | Sale Price | Title Company |
|---|---|---|---|
| Kane Michael J | $568,500 | -- | |
| Ryan Scott J | $575,000 | -- | |
| Morin Susna J | $202,500 | -- |
Source: Public Records
Mortgage History
| Date | Status | Borrower | Loan Amount |
|---|---|---|---|
| Open | Kane Michael J | $223,500 | |
| Previous Owner | Morin Susna J | $285,000 | |
| Previous Owner | Ryan Scott J | $375,000 |
Source: Public Records
Tax History Compared to Growth
Tax History
| Year | Tax Paid | Tax Assessment Tax Assessment Total Assessment is a certain percentage of the fair market value that is determined by local assessors to be the total taxable value of land and additions on the property. | Land | Improvement |
|---|---|---|---|---|
| 2025 | $4,317 | $996,900 | $527,200 | $469,700 |
| 2024 | $4,148 | $944,800 | $507,000 | $437,800 |
| 2023 | $4,012 | $859,000 | $460,900 | $398,100 |
| 2022 | $3,745 | $668,700 | $373,700 | $295,000 |
| 2021 | $4,266 | $633,600 | $366,300 | $267,300 |
| 2020 | $3,609 | $591,600 | $348,900 | $242,700 |
| 2019 | $3,408 | $552,300 | $342,100 | $210,200 |
| 2018 | $3,116 | $519,200 | $325,600 | $193,600 |
| 2017 | $3,156 | $513,200 | $325,700 | $187,500 |
| 2016 | $3,279 | $502,200 | $341,900 | $160,300 |
| 2015 | $3,214 | $502,200 | $341,900 | $160,300 |
| 2014 | $3,017 | $475,100 | $314,800 | $160,300 |
Source: Public Records
Map
Nearby Homes
- 2 Rita Mary Way
- 181 Pleasant St
- 14 Schoolhouse Ln
- 308 Old Main St
- 209 Main St Unit 3
- 209 Main St Unit 6
- 209 Main St Unit 1
- 209 Main St Unit 2
- 209 Main St Unit 4
- 209 Main St Unit 5
- 178 School St
- 23 Doric Ave
- 45 Seth Ln
- 40 Kelley Rd
- 745 Willow St
- 22 Powhatan Rd
- 29 Bass River Rd
- 401 Main St Unit 201
- 401 Main St Unit 101
- 15 Sharon Rd