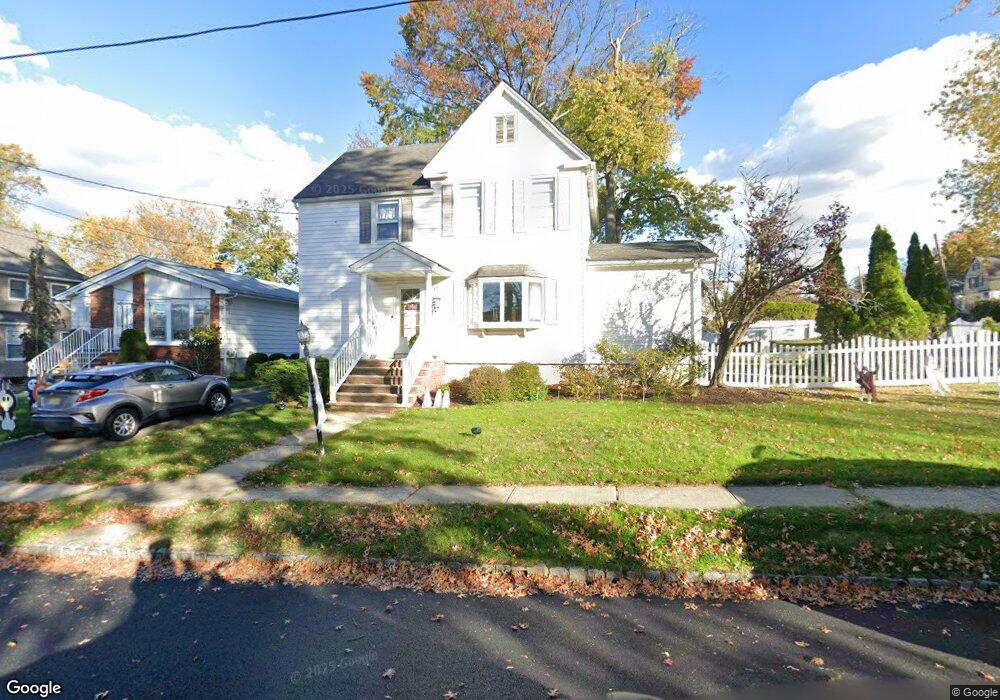
9 Garrett St Cedar Grove, NJ 07009
Estimated Value: $644,000 - $788,000
--
Bed
--
Bath
1,870
Sq Ft
$385/Sq Ft
Est. Value
About This Home
This home is located at 9 Garrett St, Cedar Grove, NJ 07009 and is currently estimated at $719,651, approximately $384 per square foot. 9 Garrett St is a home located in Essex County with nearby schools including Cedar Grove High School, St Catherine Of Siena School, and St. Cassian School.
Ownership History
Date
Name
Owned For
Owner Type
Purchase Details
Closed on
Aug 14, 1998
Sold by
Meilands Ivo
Bought by
Abromitis Michael W
Current Estimated Value
Home Financials for this Owner
Home Financials are based on the most recent Mortgage that was taken out on this home.
Original Mortgage
$182,000
Outstanding Balance
$38,035
Interest Rate
6.94%
Estimated Equity
$681,616
Purchase Details
Closed on
Jun 25, 1992
Sold by
Rosen Gary D and Rosen Catherine B
Bought by
Meilands Ivo and Meilands Patricia
Create a Home Valuation Report for This Property
The Home Valuation Report is an in-depth analysis detailing your home's value as well as a comparison with similar homes in the area
Home Values in the Area
Average Home Value in this Area
Purchase History
| Date | Buyer | Sale Price | Title Company |
|---|---|---|---|
| Abromitis Michael W | $227,500 | -- | |
| Meilands Ivo | $225,000 | -- |
Source: Public Records
Mortgage History
| Date | Status | Borrower | Loan Amount |
|---|---|---|---|
| Open | Abromitis Michael W | $182,000 |
Source: Public Records
Tax History Compared to Growth
Tax History
| Year | Tax Paid | Tax Assessment Tax Assessment Total Assessment is a certain percentage of the fair market value that is determined by local assessors to be the total taxable value of land and additions on the property. | Land | Improvement |
|---|---|---|---|---|
| 2025 | $11,320 | $433,700 | $247,600 | $186,100 |
| 2024 | $11,320 | $433,700 | $247,600 | $186,100 |
| 2022 | $11,120 | $433,700 | $247,600 | $186,100 |
| 2021 | $10,986 | $433,700 | $247,600 | $186,100 |
| 2020 | $11,146 | $433,700 | $247,600 | $186,100 |
| 2019 | $10,890 | $433,700 | $247,600 | $186,100 |
| 2018 | $10,391 | $433,700 | $247,600 | $186,100 |
| 2017 | $10,279 | $433,700 | $247,600 | $186,100 |
| 2016 | $9,962 | $433,700 | $247,600 | $186,100 |
| 2015 | $9,732 | $433,700 | $247,600 | $186,100 |
| 2014 | $9,533 | $433,700 | $247,600 | $186,100 |
Source: Public Records
Map
Nearby Homes