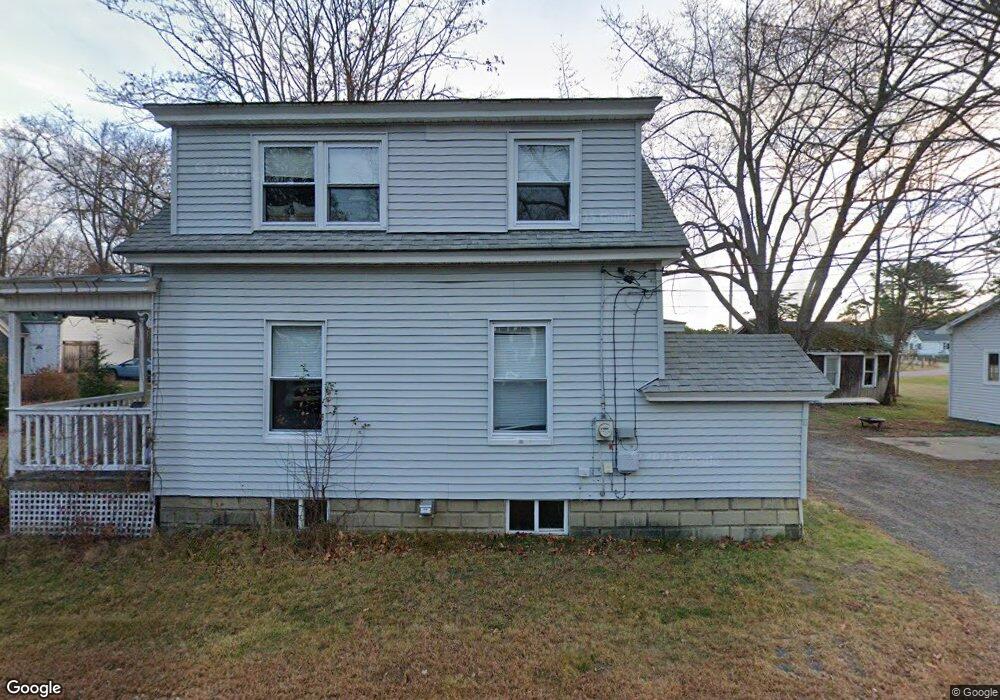
9 Garrison St Brunswick, ME 04011
Estimated Value: $330,898 - $388,000
3
Beds
1
Bath
1,035
Sq Ft
$336/Sq Ft
Est. Value
About This Home
This home is located at 9 Garrison St, Brunswick, ME 04011 and is currently estimated at $347,475, approximately $335 per square foot. 9 Garrison St is a home located in Cumberland County with nearby schools including Kate Furbish Elementary School, Brunswick Jr High School, and Brunswick High School.
Ownership History
Date
Name
Owned For
Owner Type
Purchase Details
Closed on
Sep 29, 2022
Sold by
Herrera Jeraldine and Herrera Guillermo
Bought by
Phinneybrook Prop Llc
Current Estimated Value
Purchase Details
Closed on
Feb 24, 2015
Sold by
Thurlow Charles H and Deutsche Bk Natl T Co
Bought by
Deutsche Bk Natl T Co Tr
Purchase Details
Closed on
Apr 5, 2011
Sold by
Thurlow Charles H and American General Fin Svcs
Bought by
Deutsche Bank Natl T Co and Ameriquest Mtg Sec Inc
Create a Home Valuation Report for This Property
The Home Valuation Report is an in-depth analysis detailing your home's value as well as a comparison with similar homes in the area
Home Values in the Area
Average Home Value in this Area
Purchase History
| Date | Buyer | Sale Price | Title Company |
|---|---|---|---|
| Phinneybrook Prop Llc | -- | None Available | |
| Deutsche Bk Natl T Co Tr | -- | -- | |
| Deutsche Bank Natl T Co | -- | -- |
Source: Public Records
Tax History Compared to Growth
Tax History
| Year | Tax Paid | Tax Assessment Tax Assessment Total Assessment is a certain percentage of the fair market value that is determined by local assessors to be the total taxable value of land and additions on the property. | Land | Improvement |
|---|---|---|---|---|
| 2024 | $3,671 | $153,900 | $41,400 | $112,500 |
| 2023 | $3,584 | $153,900 | $41,400 | $112,500 |
| 2022 | $3,217 | $148,300 | $41,400 | $106,900 |
| 2021 | $3,094 | $148,300 | $41,400 | $106,900 |
| 2020 | $3,021 | $148,300 | $41,400 | $106,900 |
| 2019 | $2,924 | $148,300 | $41,400 | $106,900 |
| 2018 | $2,806 | $148,300 | $41,400 | $106,900 |
| 2017 | $2,724 | $148,300 | $41,400 | $106,900 |
| 2016 | $2,275 | $77,500 | $14,400 | $63,100 |
| 2015 | $2,167 | $76,400 | $14,400 | $62,000 |
| 2014 | $1,902 | $76,400 | $14,400 | $62,000 |
| 2013 | -- | $76,400 | $14,400 | $62,000 |
Source: Public Records
Map
Nearby Homes
- 32 Chamberlain Ave
- 6 Breckan Rd
- 35 & 35.5 Bath Rd
- 35.5 Bath Rd
- 35 Bath Rd
- 8 Mckeen St
- 2 Brookmere Way
- 185 Harpswell Rd
- 2 Foxglove Way Unit 89
- 39 Thompson St
- 51 Mckeen St
- 67 Mckeen St
- 26 Merrymeeting Rd
- 86 Merrymeeting Rd
- 60 County Crossing
- 19 Mason St
- 0 Melden Dr
- 6 Melden Dr
- 22 Oak St Unit 1
- 51B Mckeen St