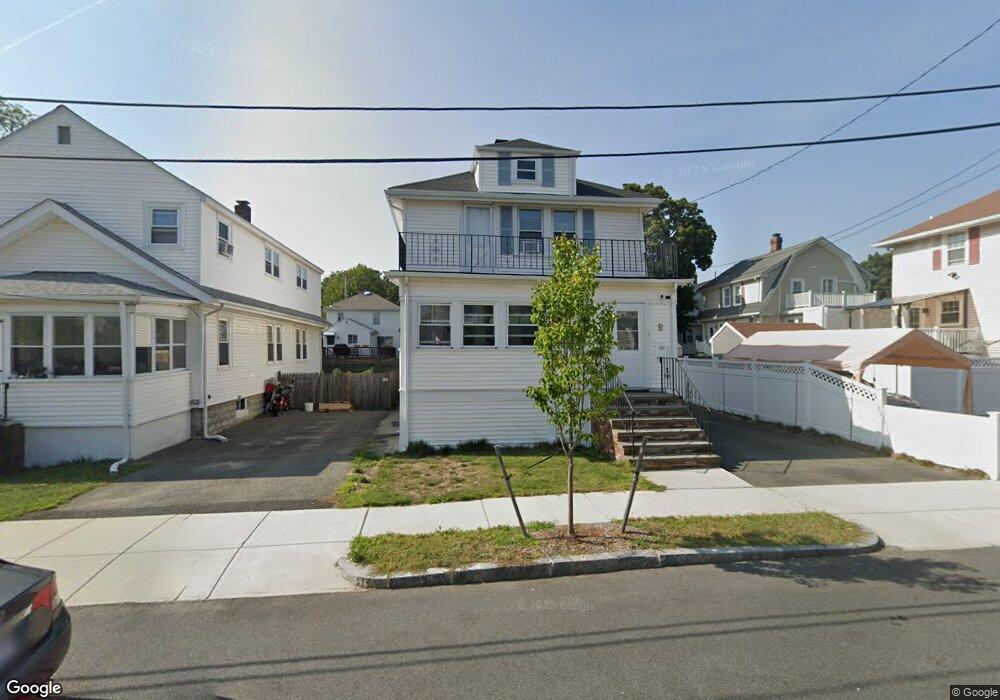
9 George Rd Quincy, MA 02170
Quincy Center NeighborhoodEstimated Value: $649,000 - $721,058
About This Home
This home is located at 9 George Rd, Quincy, MA 02170 and is currently estimated at $678,265, approximately $504 per square foot. 9 George Rd is a home located in Norfolk County with nearby schools including Charles A. Bernazzani Elementary School, Central Middle School, and North Quincy High School.
Ownership History
We collect this data history from publicly available records. To have your information removed, we recommend requesting removal directly through your county’s website.
Purchase Details
Home Financials for this Owner
Home Financials are based on the most recent Mortgage that was taken out on this home.Purchase Details
Purchase Details
Home Values in the Area
Average Home Value in this Area
Purchase History
We collect this data history from publicly available records. To have your information removed, we recommend requesting removal directly through your county’s website.
| Date | Buyer | Sale Price | Title Company |
|---|---|---|---|
| $330,000 | -- | ||
| -- | -- | ||
| -- | -- |
Mortgage History
We collect this data history from publicly available records. To have your information removed, we recommend requesting removal directly through your county’s website.
| Date | Status | Borrower | Loan Amount |
|---|---|---|---|
| Closed | $160,000 |
Tax History
We collect this data history from publicly available records. To have your information removed, we recommend requesting removal directly through your county’s website.
| Year | Tax Paid | Tax Assessment Tax Assessment Total Assessment is a certain percentage of the fair market value that is determined by local assessors to be the total taxable value of land and additions on the property. | Land | Improvement |
|---|---|---|---|---|
| 2025 | $6,883 | $597,000 | $315,300 | $281,700 |
| 2024 | $6,666 | $591,500 | $315,300 | $276,200 |
| 2023 | $6,201 | $557,100 | $300,300 | $256,800 |
| 2022 | $5,724 | $477,800 | $240,200 | $237,600 |
| 2021 | $5,694 | $469,000 | $240,200 | $228,800 |
| 2020 | $5,587 | $449,500 | $240,200 | $209,300 |
| 2019 | $5,319 | $423,800 | $224,500 | $199,300 |
| 2018 | $5,181 | $388,400 | $204,100 | $184,300 |
| 2017 | $5,257 | $371,000 | $204,100 | $166,900 |
| 2016 | $4,907 | $341,700 | $185,500 | $156,200 |
| 2015 | $4,552 | $311,800 | $168,700 | $143,100 |
| 2014 | $4,351 | $292,800 | $160,600 | $132,200 |
Map
- 45 Oval Rd Unit 34
- 45 Oval Rd Unit 8
- 128 Prospect Ave
- 999 Hancock St Unit 313
- 87 Dewson Rd
- 1025 Hancock St Unit 10C
- 1025 Hancock St Unit 8C
- 1025 Hancock St Unit 4J
- 1025 Hancock St Unit 14F
- 1025 Hancock St Unit 2P
- 77 Adams St Unit 210
- 77 Adams St Unit 611
- 77 Adams St Unit 610
- 77 Adams St Unit 1102
- 1 Adams St Unit 401
- 44 Greenleaf St
- 13 Wentworth Rd Unit 303
- 30 Hillside Ave
- 157 Beale St Unit 6
- 157 Beale St Unit 1
Ask me questions while you tour the home.