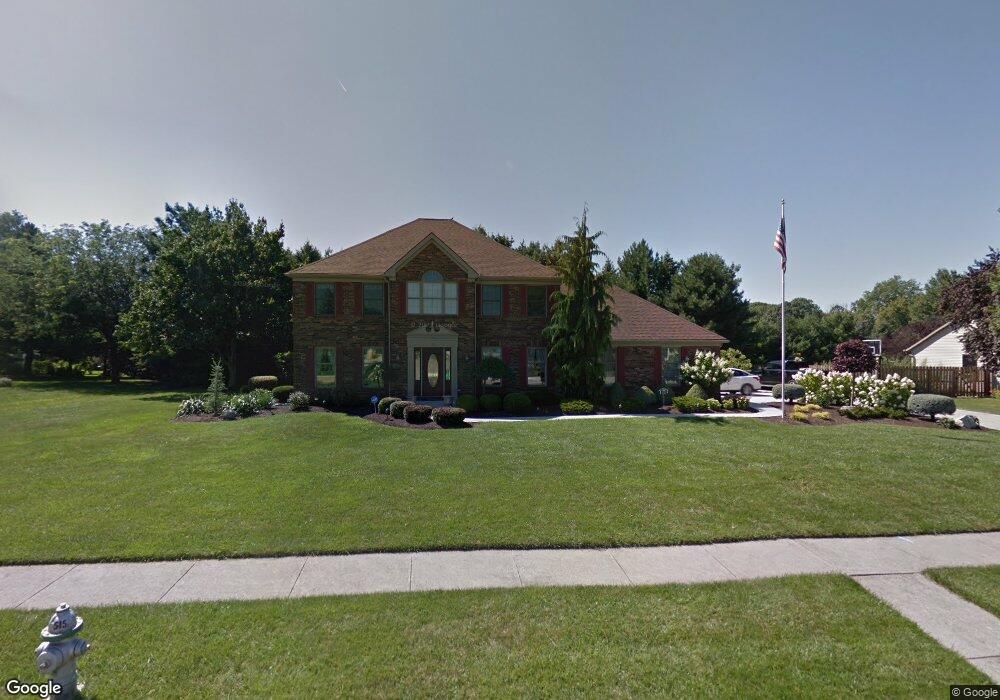
9 Gerard Dr Norwalk, OH 44857
Estimated Value: $376,000 - $572,000
4
Beds
3
Baths
3,254
Sq Ft
$141/Sq Ft
Est. Value
About This Home
This home is located at 9 Gerard Dr, Norwalk, OH 44857 and is currently estimated at $457,435, approximately $140 per square foot. 9 Gerard Dr is a home located in Huron County with nearby schools including Maplehurst Elementary School, Pleasant Elementary School, and League Elementary School.
Ownership History
Date
Name
Owned For
Owner Type
Purchase Details
Closed on
Nov 6, 2019
Sold by
Gfell Nancy J
Bought by
Gfell Nancy J and Nancy J Gfell Revocable Trust
Current Estimated Value
Purchase Details
Closed on
Apr 25, 2003
Bought by
Gfell Nancy J
Purchase Details
Closed on
Dec 23, 1998
Sold by
Mccree David B
Bought by
Schubert Thomas P
Home Financials for this Owner
Home Financials are based on the most recent Mortgage that was taken out on this home.
Original Mortgage
$172,000
Interest Rate
7.02%
Mortgage Type
New Conventional
Purchase Details
Closed on
May 1, 1996
Bought by
Mccree David B
Home Financials for this Owner
Home Financials are based on the most recent Mortgage that was taken out on this home.
Original Mortgage
$178,200
Interest Rate
7.86%
Mortgage Type
Balloon
Purchase Details
Closed on
May 13, 1987
Bought by
Denney Gene and Denney Judy
Create a Home Valuation Report for This Property
The Home Valuation Report is an in-depth analysis detailing your home's value as well as a comparison with similar homes in the area
Home Values in the Area
Average Home Value in this Area
Purchase History
| Date | Buyer | Sale Price | Title Company |
|---|---|---|---|
| Gfell Nancy J | -- | Chicago | |
| Gfell Nancy J | $247,000 | -- | |
| Schubert Thomas P | $215,000 | -- | |
| Mccree David B | $222,800 | -- | |
| Denney Gene | $24,000 | -- |
Source: Public Records
Mortgage History
| Date | Status | Borrower | Loan Amount |
|---|---|---|---|
| Previous Owner | Schubert Thomas P | $172,000 | |
| Previous Owner | Mccree David B | $178,200 |
Source: Public Records
Tax History Compared to Growth
Tax History
| Year | Tax Paid | Tax Assessment Tax Assessment Total Assessment is a certain percentage of the fair market value that is determined by local assessors to be the total taxable value of land and additions on the property. | Land | Improvement |
|---|---|---|---|---|
| 2024 | $5,527 | $135,350 | $21,260 | $114,090 |
| 2023 | $5,527 | $96,910 | $16,380 | $80,530 |
| 2022 | $3,906 | $96,910 | $16,380 | $80,530 |
| 2021 | $3,908 | $96,910 | $16,380 | $80,530 |
| 2020 | $3,999 | $94,350 | $14,960 | $79,390 |
| 2019 | $3,912 | $94,350 | $14,960 | $79,390 |
| 2018 | $3,843 | $94,350 | $14,960 | $79,390 |
| 2017 | $3,784 | $92,600 | $14,960 | $77,640 |
| 2016 | $3,714 | $92,600 | $14,960 | $77,640 |
| 2015 | $3,712 | $92,620 | $14,970 | $77,650 |
| 2014 | $3,308 | $81,830 | $12,740 | $69,090 |
| 2013 | $2,875 | $81,830 | $12,740 | $69,090 |
Source: Public Records
Map
Nearby Homes
- 29 Olive St
- 431 Old State Rd S
- 120 Woodlawn Ave
- 29 Harris Ave
- 85 Woodlawn Ave
- 15 W Chestnut St
- 58 E Elm St
- 29 Corwin St
- 40 Norwood Ave
- 11 Granny Smith St
- 14 Corwin St
- 21 Maple St
- 0 Cleveland Rd
- 123 E Main St
- 29 W Seminary St
- 57 Milan Ave
- 173 Saint Marys St
- 14 Whitefield Blvd
- 27 Whitefield Blvd
- 12 Minard Place