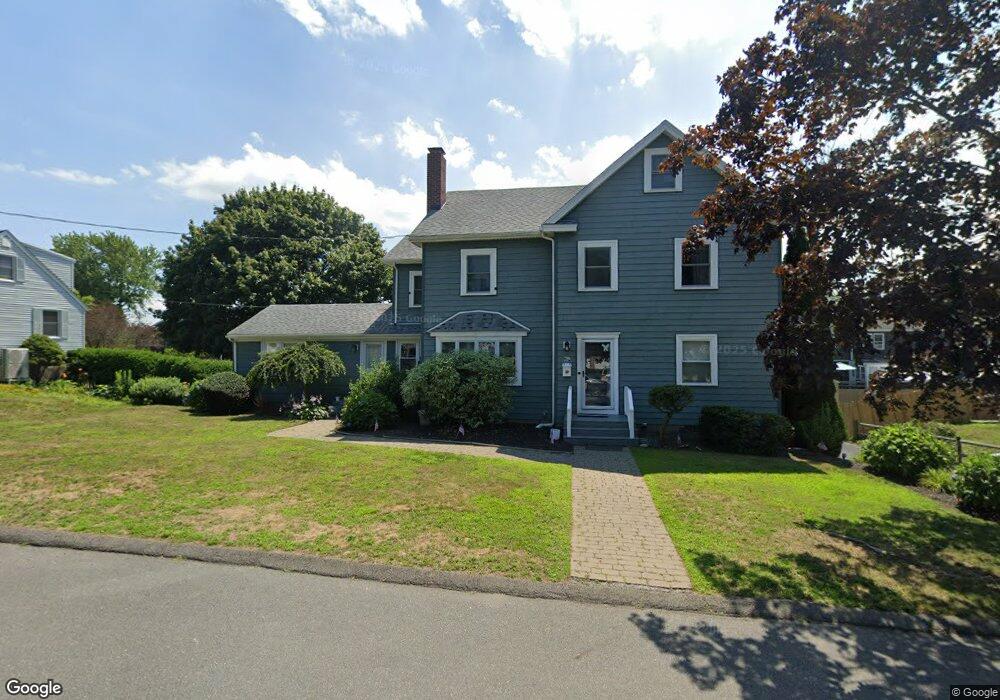
9 Girdler Rd Marblehead, MA 01945
Estimated Value: $1,316,944 - $1,429,000
4
Beds
3
Baths
3,952
Sq Ft
$348/Sq Ft
Est. Value
About This Home
This home is located at 9 Girdler Rd, Marblehead, MA 01945 and is currently estimated at $1,373,486, approximately $347 per square foot. 9 Girdler Rd is a home located in Essex County with nearby schools including Marblehead High School, Marblehead Community Charter Public School, and Tower School.
Ownership History
Date
Name
Owned For
Owner Type
Purchase Details
Closed on
Apr 18, 2014
Sold by
Baker Amie E
Bought by
James Amie and James Frank H
Current Estimated Value
Home Financials for this Owner
Home Financials are based on the most recent Mortgage that was taken out on this home.
Original Mortgage
$200,000
Outstanding Balance
$96,953
Interest Rate
4.26%
Mortgage Type
New Conventional
Estimated Equity
$1,276,533
Purchase Details
Closed on
Dec 4, 2007
Sold by
9 Girdler Road Rt and Baker
Bought by
Baker Amie E
Purchase Details
Closed on
Jul 25, 1997
Sold by
Maciver Frank W
Bought by
Baker Garrett D
Home Financials for this Owner
Home Financials are based on the most recent Mortgage that was taken out on this home.
Original Mortgage
$164,500
Interest Rate
7.7%
Mortgage Type
Purchase Money Mortgage
Purchase Details
Closed on
Jun 20, 1988
Sold by
Lund Dorothy A
Bought by
Maciver Frank W
Create a Home Valuation Report for This Property
The Home Valuation Report is an in-depth analysis detailing your home's value as well as a comparison with similar homes in the area
Home Values in the Area
Average Home Value in this Area
Purchase History
| Date | Buyer | Sale Price | Title Company |
|---|---|---|---|
| James Amie | -- | -- | |
| James Amie | -- | -- | |
| Baker Amie E | -- | -- | |
| Baker Amie E | -- | -- | |
| Baker Amie E | -- | -- | |
| Baker Garrett D | $235,000 | -- | |
| Baker Garrett D | $235,000 | -- | |
| Baker Garrett D | $235,000 | -- | |
| Maciver Frank W | $195,000 | -- |
Source: Public Records
Mortgage History
| Date | Status | Borrower | Loan Amount |
|---|---|---|---|
| Open | James Amie | $200,000 | |
| Closed | Maciver Frank W | $200,000 | |
| Previous Owner | Baker Garrett D | $164,500 | |
| Previous Owner | Maciver Frank W | $160,000 |
Source: Public Records
Tax History
| Year | Tax Paid | Tax Assessment Tax Assessment Total Assessment is a certain percentage of the fair market value that is determined by local assessors to be the total taxable value of land and additions on the property. | Land | Improvement |
|---|---|---|---|---|
| 2025 | $10,576 | $1,168,600 | $604,600 | $564,000 |
| 2024 | $10,049 | $1,121,500 | $577,700 | $543,800 |
| 2023 | $9,828 | $982,800 | $550,900 | $431,900 |
| 2022 | $9,172 | $871,900 | $450,100 | $421,800 |
| 2021 | $8,805 | $845,000 | $429,900 | $415,100 |
| 2020 | $8,582 | $826,000 | $429,900 | $396,100 |
| 2019 | $8,258 | $768,900 | $389,600 | $379,300 |
| 2018 | $8,178 | $742,100 | $362,800 | $379,300 |
| 2017 | $7,727 | $701,800 | $322,500 | $379,300 |
| 2016 | $5,034 | $453,500 | $309,000 | $144,500 |
| 2015 | $4,501 | $406,200 | $295,600 | $110,600 |
| 2014 | $4,026 | $363,000 | $255,300 | $107,700 |
Source: Public Records
Map
Nearby Homes
- 30 Haley Rd Unit 1
- 70 Maverick St
- 6 Mount Vernon St
- 282 Pleasant St
- 290 Washington St Unit A
- 7 Cottage St
- 55 Roosevelt Ave
- 1 Knollwood Rd
- 33 W Shore Dr
- 41 Atlantic Ave Unit 1
- 23 Wyman Rd
- 132 Elm St
- 132 Elm St Unit 132
- 66 Pleasant St Unit 1
- 66 Pleasant St Unit 2
- 9 Lincoln Park
- 55 Brackett Place Unit B
- 45 Pleasant St
- 26 Summer St Unit 1
- 9 Darling St
Your Personal Tour Guide
Ask me questions while you tour the home.