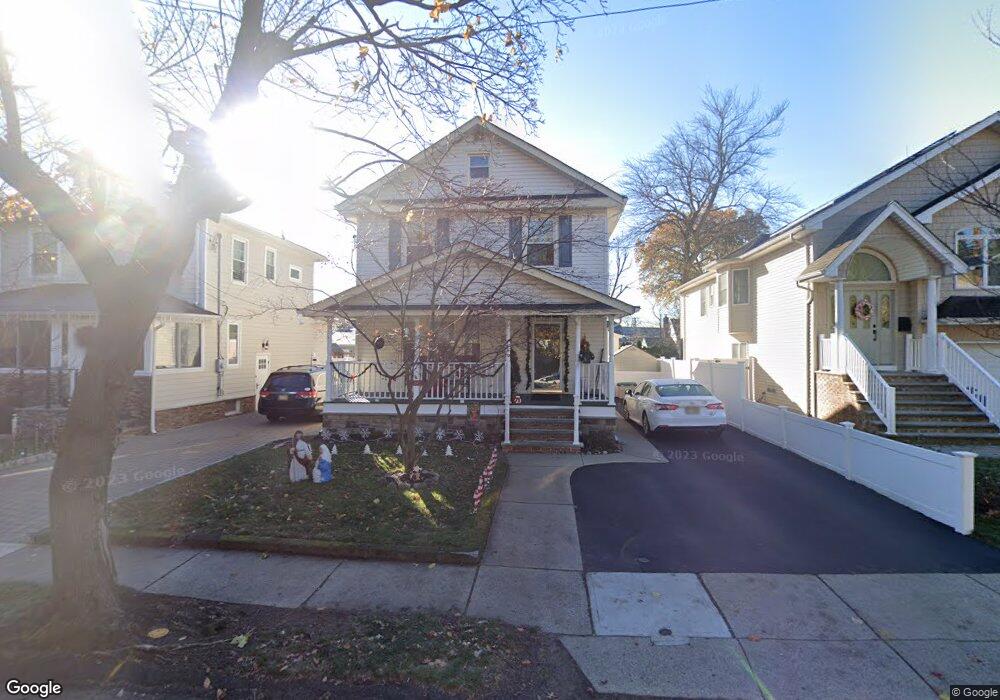
9 Gordon Ave Dumont, NJ 07628
Estimated Value: $523,000 - $621,000
Studio
--
Bath
1,497
Sq Ft
$383/Sq Ft
Est. Value
About This Home
This home is located at 9 Gordon Ave, Dumont, NJ 07628 and is currently estimated at $572,642, approximately $382 per square foot. 9 Gordon Ave is a home located in Bergen County with nearby schools including Dumont High School.
Ownership History
Date
Name
Owned For
Owner Type
Purchase Details
Closed on
Oct 26, 2020
Sold by
Roman Victor and Estate Of Julia E Roman
Bought by
Roman Victor
Current Estimated Value
Purchase Details
Closed on
Jun 19, 2017
Sold by
Plitt Adam E and Plitt Sarah Webster
Bought by
Santos Jose V
Purchase Details
Closed on
Aug 5, 2016
Sold by
Roman Julia E and Fernandez Julia
Bought by
Roman Julia E
Home Financials for this Owner
Home Financials are based on the most recent Mortgage that was taken out on this home.
Original Mortgage
$255,019
Interest Rate
3.25%
Mortgage Type
FHA
Purchase Details
Closed on
Aug 27, 2009
Sold by
Hille Robert B
Bought by
Fernandez Julia
Home Financials for this Owner
Home Financials are based on the most recent Mortgage that was taken out on this home.
Original Mortgage
$279,000
Interest Rate
5.36%
Mortgage Type
Purchase Money Mortgage
Create a Home Valuation Report for This Property
The Home Valuation Report is an in-depth analysis detailing your home's value as well as a comparison with similar homes in the area
Home Values in the Area
Average Home Value in this Area
Purchase History
| Date | Buyer | Sale Price | Title Company |
|---|---|---|---|
| Roman Victor | -- | None Available | |
| Santos Jose V | $355,000 | None Available | |
| Roman Julia E | -- | None Available | |
| Fernandez Julia | $290,000 | -- |
Source: Public Records
Mortgage History
| Date | Status | Borrower | Loan Amount |
|---|---|---|---|
| Previous Owner | Roman Julia E | $255,019 | |
| Previous Owner | Fernandez Julia | $279,000 |
Source: Public Records
Tax History
| Year | Tax Paid | Tax Assessment Tax Assessment Total Assessment is a certain percentage of the fair market value that is determined by local assessors to be the total taxable value of land and additions on the property. | Land | Improvement |
|---|---|---|---|---|
| 2025 | $10,297 | $543,700 | $278,100 | $265,600 |
| 2024 | $10,043 | $253,300 | $154,300 | $99,000 |
| 2023 | $9,836 | $253,300 | $154,300 | $99,000 |
| 2022 | $9,836 | $253,300 | $154,300 | $99,000 |
| 2021 | $9,788 | $253,300 | $154,300 | $99,000 |
| 2020 | $9,522 | $253,300 | $154,300 | $99,000 |
| 2019 | $9,294 | $253,300 | $154,300 | $99,000 |
| 2018 | $9,104 | $253,300 | $154,300 | $99,000 |
| 2017 | $8,798 | $249,600 | $154,300 | $95,300 |
| 2016 | $8,594 | $249,600 | $154,300 | $95,300 |
| 2015 | $8,397 | $249,600 | $154,300 | $95,300 |
| 2014 | $8,232 | $249,600 | $154,300 | $95,300 |
Source: Public Records
Map
Nearby Homes
- 112 Oxford Place
- 42 Lenox Ave
- 211 Bedford Rd
- 116 Lexington Ave
- 64 Harwich Rd
- 19 Bedford Rd
- 15 Pleasant St
- 82 Blauvelt Ave
- 79 Blauvelt Ave
- 7 Overlook Dr
- 144 New Milford Ave
- 95 W Shore Ave
- 455 Sunset Ave
- 16 Roosevelt Ave
- 496 Prospect Ave
- 502 Prospect Ave
- 28 Park Ave
- 40 Depew St
- 592 Fermery Dr
- 226 Haworth Ave
- 11 Gordon Ave
- 7 Gordon Ave
- 15 Gordon Ave
- 5 Gordon Ave
- 450 Washington Ave
- 450 Washington Ave Unit 2nd fl
- 450 Washington Ave Unit 1
- 450 Washington Ave Unit 2nd floor
- 19 Gordon Ave
- 6 Huntting Dr
- 3 Gordon Ave
- 8 Huntting Dr
- 23 Gordon Ave
- 10 Huntting Dr
- 44 Gordon Ave
- 27 Gordon Ave
- 1 Gordon Ave
- 12 Huntting Dr
- 407 Washington Ave
- 48 Gordon Ave
Your Personal Tour Guide
Ask me questions while you tour the home.