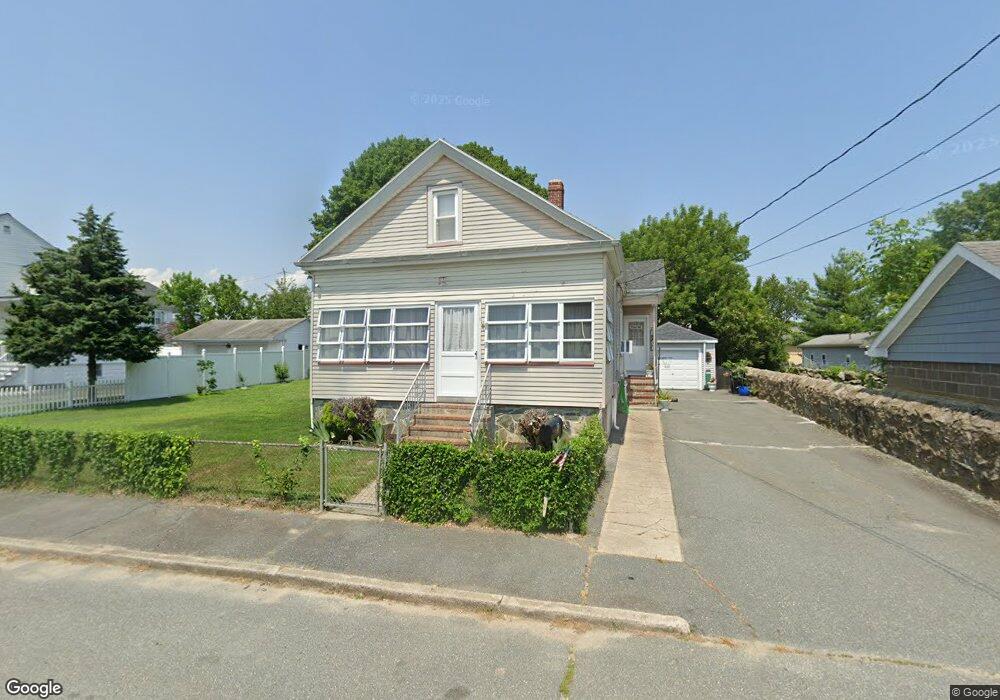
9 Gorham St South Dartmouth, MA 02748
Bliss Corner NeighborhoodEstimated Value: $335,000 - $414,833
2
Beds
1
Bath
805
Sq Ft
$468/Sq Ft
Est. Value
About This Home
This home is located at 9 Gorham St, South Dartmouth, MA 02748 and is currently estimated at $376,708, approximately $467 per square foot. 9 Gorham St is a home located in Bristol County with nearby schools including Dartmouth High School and St. Teresa of Calcutta School.
Ownership History
Date
Name
Owned For
Owner Type
Purchase Details
Closed on
Aug 31, 2021
Sold by
Maria M Cruz Ret
Bought by
Gorham Holdings Llc
Current Estimated Value
Purchase Details
Closed on
Apr 25, 2014
Sold by
Cruz Anthony A and Cruz Maria M
Bought by
Maria M Cruz Ret
Purchase Details
Closed on
Dec 31, 2013
Sold by
Cruz Anthony A and Cruz Maria M
Bought by
Cruz Anthony A and Cruz Maria M
Purchase Details
Closed on
Feb 28, 2012
Sold by
Cruz Maria M and Cruz Paul A
Bought by
Cruz Anthony and Cruz Maria M
Purchase Details
Closed on
Sep 19, 2006
Sold by
Cruz Anthony A
Bought by
Cruz Maria M and Cruz Paul A
Purchase Details
Closed on
Feb 17, 2005
Sold by
Costa David and Costa John D
Bought by
Cruz Anthony A
Home Financials for this Owner
Home Financials are based on the most recent Mortgage that was taken out on this home.
Original Mortgage
$176,000
Interest Rate
5.78%
Mortgage Type
Purchase Money Mortgage
Purchase Details
Closed on
Aug 31, 2004
Sold by
Costa John D and Costa John S
Bought by
Costa Ft
Create a Home Valuation Report for This Property
The Home Valuation Report is an in-depth analysis detailing your home's value as well as a comparison with similar homes in the area
Home Values in the Area
Average Home Value in this Area
Purchase History
| Date | Buyer | Sale Price | Title Company |
|---|---|---|---|
| Gorham Holdings Llc | -- | None Available | |
| Maria M Cruz Ret | -- | -- | |
| Cruz Anthony A | -- | -- | |
| Cruz Anthony | -- | -- | |
| Cruz Maria M | -- | -- | |
| Cruz Anthony A | $220,000 | -- | |
| Costa Ft | -- | -- |
Source: Public Records
Mortgage History
| Date | Status | Borrower | Loan Amount |
|---|---|---|---|
| Previous Owner | Costa Ft | $176,000 |
Source: Public Records
Tax History Compared to Growth
Tax History
| Year | Tax Paid | Tax Assessment Tax Assessment Total Assessment is a certain percentage of the fair market value that is determined by local assessors to be the total taxable value of land and additions on the property. | Land | Improvement |
|---|---|---|---|---|
| 2025 | $2,468 | $286,600 | $120,100 | $166,500 |
| 2024 | $2,363 | $271,900 | $120,100 | $151,800 |
| 2023 | $2,348 | $256,100 | $120,100 | $136,000 |
| 2022 | $2,323 | $234,600 | $120,100 | $114,500 |
| 2021 | $2,125 | $205,100 | $116,600 | $88,500 |
| 2020 | $2,053 | $197,800 | $115,400 | $82,400 |
| 2019 | $2,023 | $194,500 | $110,700 | $83,800 |
| 2018 | $1,997 | $188,900 | $113,100 | $75,800 |
| 2017 | $1,795 | $179,100 | $104,500 | $74,600 |
| 2016 | $1,659 | $163,300 | $92,400 | $70,900 |
| 2015 | $1,605 | $158,300 | $86,300 | $72,000 |
| 2014 | $1,577 | $154,500 | $83,900 | $70,600 |
Source: Public Records
Map
Nearby Homes