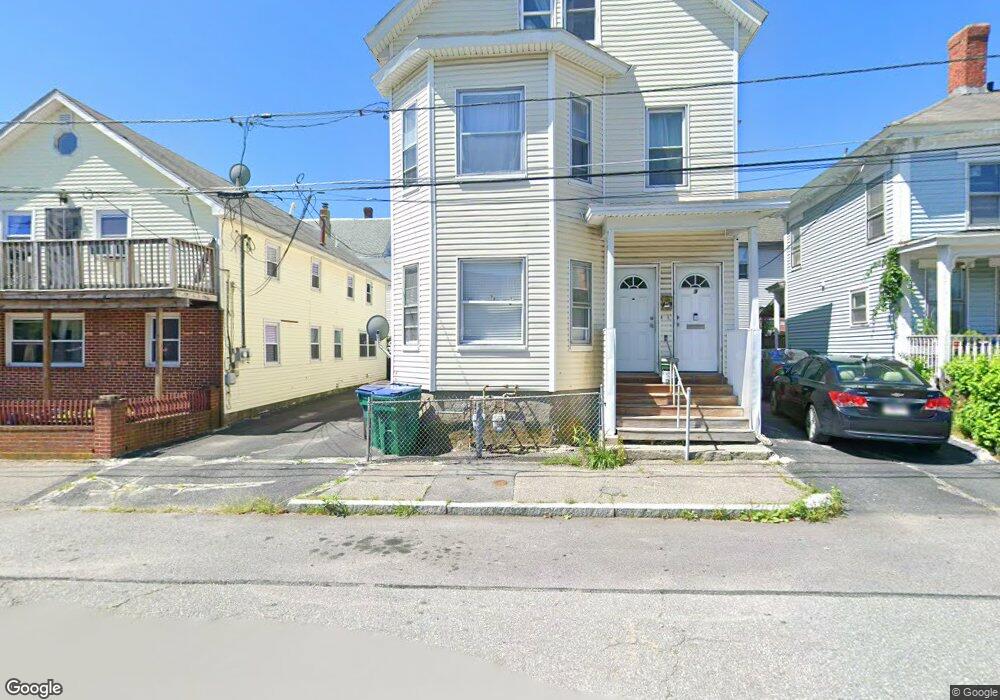
9 Greendale Ave Lowell, MA 01851
Lower Highlands NeighborhoodEstimated Value: $542,387 - $665,000
6
Beds
2
Baths
2,759
Sq Ft
$228/Sq Ft
Est. Value
About This Home
This home is located at 9 Greendale Ave, Lowell, MA 01851 and is currently estimated at $630,097, approximately $228 per square foot. 9 Greendale Ave is a home located in Middlesex County with nearby schools including Abraham Lincoln Elementary School, Charles W. Morey Elementary School, and Moody Elementary School.
Ownership History
Date
Name
Owned For
Owner Type
Purchase Details
Closed on
Jun 5, 2024
Sold by
Huot Ratana and Huot Victor
Bought by
Huot Ratana and Huot Malinda
Current Estimated Value
Purchase Details
Closed on
Jan 19, 2021
Sold by
Huot Ratana and Huot Malinda
Bought by
Huot Ratana and Huot Victor
Purchase Details
Closed on
Oct 29, 2009
Sold by
Aurora Loan Service Ll
Bought by
Huot Ratana and Huot Malinda
Purchase Details
Closed on
Mar 17, 2009
Sold by
Chhit Phal Kunn and Aurora Loan Svcs Llc
Bought by
Aurora Loan Svcs Llc
Purchase Details
Closed on
May 17, 2006
Sold by
Chou Hay and Yim Saphay
Bought by
Chhit Phal Kunn
Home Financials for this Owner
Home Financials are based on the most recent Mortgage that was taken out on this home.
Original Mortgage
$270,400
Interest Rate
6.42%
Mortgage Type
Purchase Money Mortgage
Create a Home Valuation Report for This Property
The Home Valuation Report is an in-depth analysis detailing your home's value as well as a comparison with similar homes in the area
Home Values in the Area
Average Home Value in this Area
Purchase History
| Date | Buyer | Sale Price | Title Company |
|---|---|---|---|
| Huot Ratana | -- | None Available | |
| Huot Ratana | -- | None Available | |
| Huot Ratana | -- | None Available | |
| Huot Ratana | -- | None Available | |
| Huot Ratana | $165,000 | -- | |
| Huot Ratana | $165,000 | -- | |
| Huot Ratana | $165,000 | -- | |
| Aurora Loan Svcs Llc | $138,000 | -- | |
| Aurora Loan Svcs Llc | $138,000 | -- | |
| Chhit Phal Kunn | $338,000 | -- | |
| Chhit Phal Kunn | $338,000 | -- |
Source: Public Records
Mortgage History
| Date | Status | Borrower | Loan Amount |
|---|---|---|---|
| Previous Owner | Chhit Phal Kunn | $165,000 | |
| Previous Owner | Chhit Phal Kunn | $270,400 |
Source: Public Records
Tax History Compared to Growth
Tax History
| Year | Tax Paid | Tax Assessment Tax Assessment Total Assessment is a certain percentage of the fair market value that is determined by local assessors to be the total taxable value of land and additions on the property. | Land | Improvement |
|---|---|---|---|---|
| 2025 | $5,779 | $503,400 | $94,900 | $408,500 |
| 2024 | $5,357 | $449,800 | $88,700 | $361,100 |
| 2023 | $4,988 | $401,600 | $77,100 | $324,500 |
| 2022 | $4,497 | $354,400 | $61,000 | $293,400 |
| 2021 | $4,170 | $309,800 | $53,000 | $256,800 |
| 2020 | $3,869 | $289,600 | $53,000 | $236,600 |
| 2019 | $3,608 | $257,000 | $50,400 | $206,600 |
| 2018 | $3,353 | $233,000 | $48,000 | $185,000 |
| 2017 | $3,212 | $215,300 | $46,600 | $168,700 |
| 2016 | $3,199 | $211,000 | $43,200 | $167,800 |
| 2015 | $2,932 | $189,400 | $43,200 | $146,200 |
| 2013 | $2,643 | $176,100 | $51,900 | $124,200 |
Source: Public Records
Map
Nearby Homes
- 84 Cambridge St
- 53 Royal St
- 15 Barclay St
- 46 Bellevue St
- 201 Thorndike St Unit 501
- 201 Thorndike St Unit 1-23
- 27 Bellevue St
- 195 Thorndike St Unit 4
- 100 Lane St
- 173 Westford St
- 45 Marshall St
- 31 Waite St
- 22 Grand St
- 21 Kimball Ave
- 17 Burns St Unit D
- 710 School St
- 42 Branch St
- 762 Gorham St Unit 3
- 8 Cedar Ct
- 43 Cedar St
- 174 Hale St
- 15 Greendale Ave
- 180 Hale St
- 50 Cambridge St
- 56 Cambridge St
- 62 Cambridge St
- 29 Greendale Ave
- 153 Hale St
- 66 Cambridge St
- 63 Cambridge St
- 49 Cambridge St Unit 11
- 49 Cambridge St Unit 4
- 49 Cambridge St Unit 3
- 49 Cambridge St Unit 1
- 49 Cambridge St Unit 5
- 49 Cambridge St Unit 7
- 49 Cambridge St Unit 10
- 49 Cambridge St Unit 6
- 49 Cambridge St Unit 8
- 49 Cambridge St Unit 2