
Landlord's Agent in 2019
Lauren Mailloux
Our Real Estate
(631) 902-7082
28 Total Sales
Estimated Value: $488,000 - $817,000
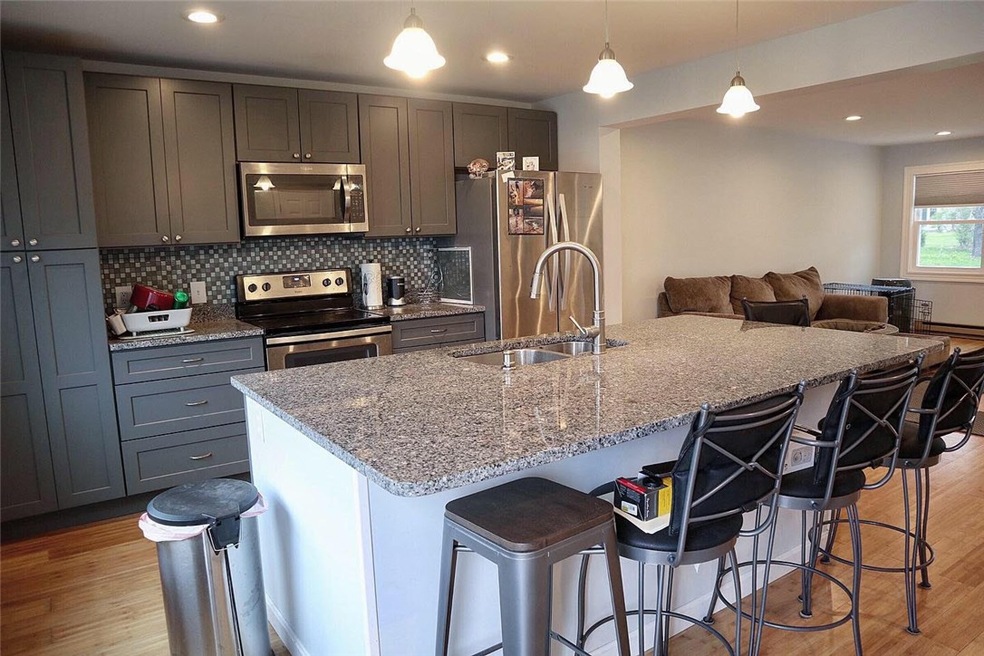
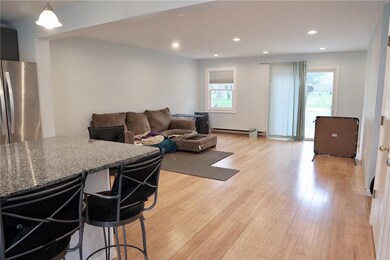
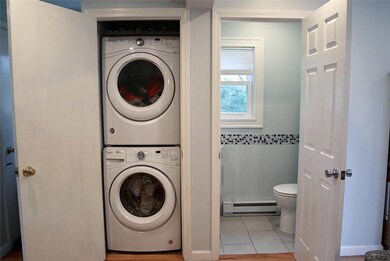
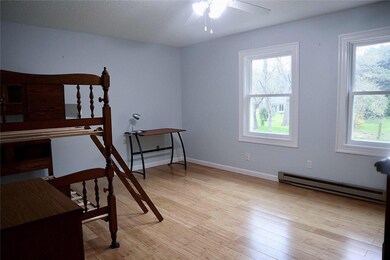
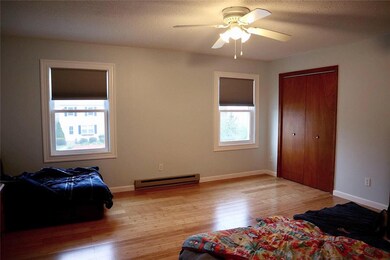
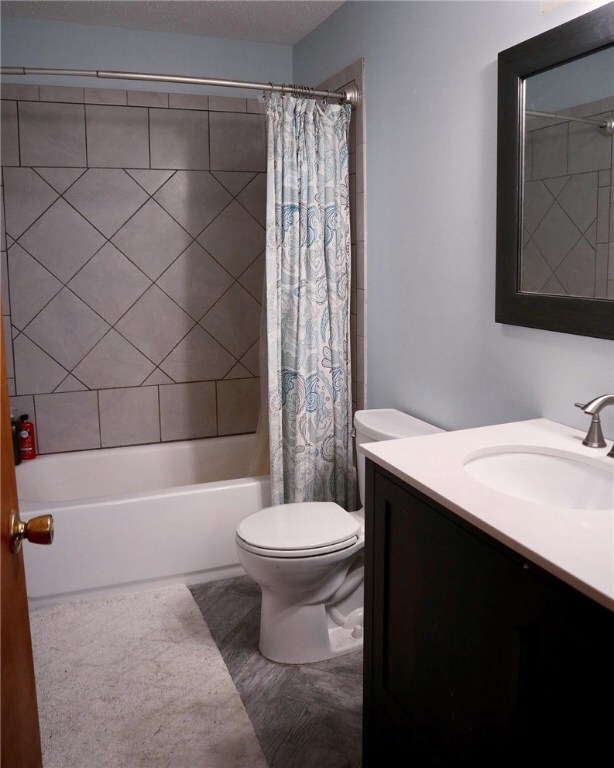
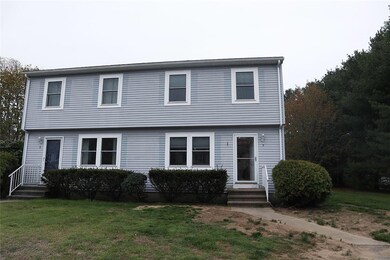
Updated townhouse, duplex apartment available June 15th for the yearly term. Located a short distance to Misquamicut beach, shops, and restaurants. This rental has two large bedrooms, one full and one half bathrooms, washer and dryer in-unit, and off-street parking. The kitchen boasts granite countertops, updated appliances, and a large island perfect for cooking, dining, and entertaining. Extra storage space is available in the large, clean basement. The deck off the back of the house leads to a large yard.
Last Agent to Rent the Property
Our Real Estate License #REC.0018779 Listed on: 05/14/2019
| Date | Buyer | Sale Price | Title Company |
|---|---|---|---|
| R Quinn Corp | $1,395 | -- | |
| Sg Mtg Sec T | -- | -- |
| Date | Event | Price | List to Sale | Price per Sq Ft | Prior Sale |
|---|---|---|---|---|---|
| 06/17/2019 06/17/19 | Rented | $1,450 | -9.4% | -- | |
| 05/18/2019 05/18/19 | Under Contract | -- | -- | -- | |
| 05/14/2019 05/14/19 | For Rent | $1,600 | 0.0% | -- | |
| 05/26/2017 05/26/17 | Sold | $280,000 | +5.7% | $120 / Sq Ft | View Prior Sale |
| 04/26/2017 04/26/17 | Pending | -- | -- | -- | |
| 04/22/2017 04/22/17 | For Sale | $265,000 | -- | $113 / Sq Ft |
| Year | Tax Paid | Tax Assessment Tax Assessment Total Assessment is a certain percentage of the fair market value that is determined by local assessors to be the total taxable value of land and additions on the property. | Land | Improvement |
|---|---|---|---|---|
| 2025 | $3,372 | $474,200 | $188,700 | $285,500 |
| 2024 | $3,431 | $349,700 | $134,800 | $214,900 |
| 2023 | $3,364 | $349,700 | $134,800 | $214,900 |
| 2022 | $3,343 | $349,700 | $134,800 | $214,900 |
| 2021 | $3,424 | $297,200 | $117,200 | $180,000 |
| 2020 | $3,361 | $297,200 | $117,200 | $180,000 |
| 2019 | $3,329 | $297,200 | $117,200 | $180,000 |
| 2018 | $3,190 | $268,500 | $117,200 | $151,300 |
| 2017 | $3,112 | $268,500 | $117,200 | $151,300 |
| 2016 | $3,136 | $268,500 | $117,200 | $151,300 |
| 2015 | $3,022 | $279,300 | $119,600 | $159,700 |
| 2014 | $2,972 | $279,300 | $119,600 | $159,700 |
Landlord's Agent in 2019
Lauren Mailloux
Our Real Estate
(631) 902-7082
28 Total Sales
Seller's Agent in 2017
Donald Liberatore
Donald J. Liberatore
(860) 989-7969
Buyer's Agent in 2017
Andy Schilke
Schilke Realty
(401) 326-2013
107 in this area
240 Total Sales
Source: State-Wide MLS
MLS Number: 1223451
APN: WEST-000122-000034C
Disclaimer: Certain information contained herein is derived from information provided by parties other than Homes.com. All information provided is deemed reliable, but is not guaranteed to be accurate and should be independently verified.
![]() IDX information is provided exclusively for personal, non-commercial use, and may not be used for any purpose other than to identify prospective properties consumers may be interested in purchasing. Information is deemed reliable but not guaranteed.
IDX information is provided exclusively for personal, non-commercial use, and may not be used for any purpose other than to identify prospective properties consumers may be interested in purchasing. Information is deemed reliable but not guaranteed.
Copyright © 2025 State-Wide MLS, Inc. All rights reserved.