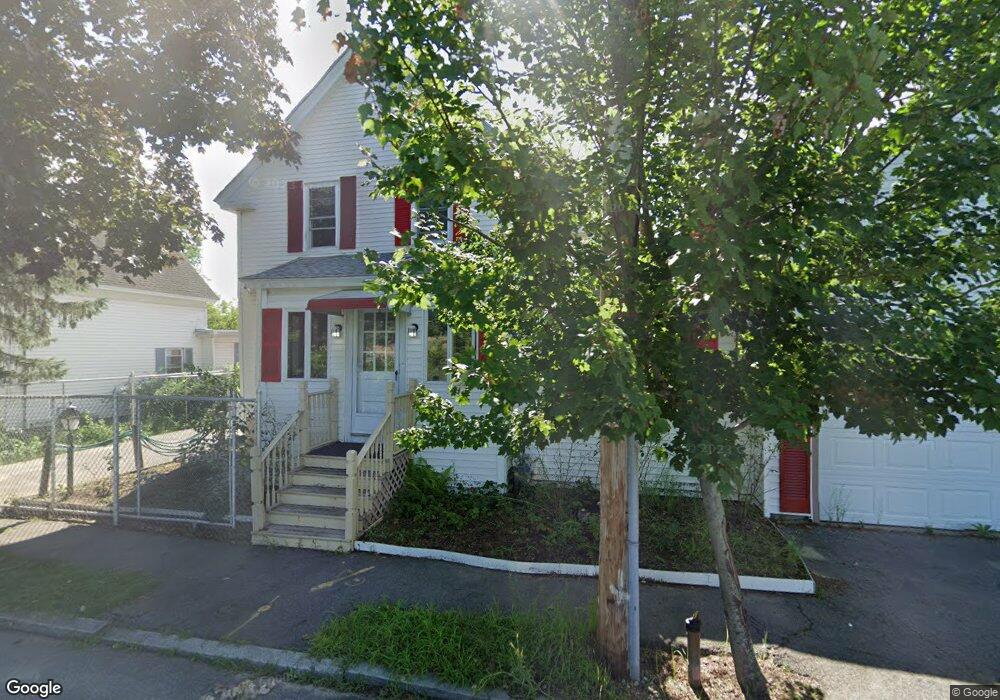
9 Griffin St Methuen, MA 01844
The West End NeighborhoodEstimated Value: $624,000 - $692,000
3
Beds
2
Baths
1,794
Sq Ft
$368/Sq Ft
Est. Value
About This Home
This home is located at 9 Griffin St, Methuen, MA 01844 and is currently estimated at $660,160, approximately $367 per square foot. 9 Griffin St is a home located in Essex County with nearby schools including Marsh Grammar School, Methuen High School, and The Islamic Academy For Peace.
Ownership History
Date
Name
Owned For
Owner Type
Purchase Details
Closed on
Sep 28, 2021
Sold by
Taveras Samuel
Bought by
Salazar-Reyes Yokaty
Current Estimated Value
Home Financials for this Owner
Home Financials are based on the most recent Mortgage that was taken out on this home.
Original Mortgage
$532,000
Outstanding Balance
$480,904
Interest Rate
2.8%
Mortgage Type
Purchase Money Mortgage
Estimated Equity
$179,256
Purchase Details
Closed on
Jul 15, 2010
Sold by
Cinquini Marco and Bac Home Loans Svcng L
Bought by
Federal National Mortgage Association
Purchase Details
Closed on
May 25, 2007
Sold by
Stackelin John C and Stackelin Judith A
Bought by
Cinquini Marco and Cinquini Sandra N
Home Financials for this Owner
Home Financials are based on the most recent Mortgage that was taken out on this home.
Original Mortgage
$296,000
Interest Rate
6.27%
Mortgage Type
Purchase Money Mortgage
Create a Home Valuation Report for This Property
The Home Valuation Report is an in-depth analysis detailing your home's value as well as a comparison with similar homes in the area
Home Values in the Area
Average Home Value in this Area
Purchase History
| Date | Buyer | Sale Price | Title Company |
|---|---|---|---|
| Salazar-Reyes Yokaty | $560,000 | None Available | |
| Federal National Mortgage Association | $256,570 | -- | |
| Federal National Mortgage Association | $256,570 | -- | |
| Cinquini Marco | $296,000 | -- | |
| Cinquini Marco | $296,000 | -- |
Source: Public Records
Mortgage History
| Date | Status | Borrower | Loan Amount |
|---|---|---|---|
| Open | Salazar-Reyes Yokaty | $532,000 | |
| Closed | Salazar-Reyes Yokaty | $532,000 | |
| Previous Owner | Cinquini Marco | $296,000 | |
| Previous Owner | Cinquini Marco | $30,000 | |
| Previous Owner | Cinquini Marco | $61,000 |
Source: Public Records
Tax History
| Year | Tax Paid | Tax Assessment Tax Assessment Total Assessment is a certain percentage of the fair market value that is determined by local assessors to be the total taxable value of land and additions on the property. | Land | Improvement |
|---|---|---|---|---|
| 2025 | $5,928 | $560,300 | $206,900 | $353,400 |
| 2024 | $5,788 | $533,000 | $188,100 | $344,900 |
| 2023 | $5,588 | $477,600 | $166,400 | $311,200 |
| 2022 | $4,785 | $366,700 | $137,500 | $229,200 |
| 2021 | $4,518 | $342,500 | $130,200 | $212,300 |
| 2020 | $4,490 | $334,100 | $130,200 | $203,900 |
| 2019 | $4,373 | $308,200 | $123,000 | $185,200 |
| 2018 | $4,287 | $300,400 | $123,000 | $177,400 |
| 2017 | $4,090 | $279,200 | $115,800 | $163,400 |
| 2016 | $4,093 | $276,400 | $115,800 | $160,600 |
| 2015 | $3,773 | $258,400 | $108,500 | $149,900 |
Source: Public Records
Map
Nearby Homes
- 71 N Lowell St
- 16 Green St
- 22 Falcon St
- 2 Landmark Dr
- 65 Clayton Ave
- 945 Riverside Dr Unit 8A
- 945 Riverside Dr Unit 3B
- 76 Haverhill St
- 3 Oxyoke Dr
- 13 Caswell Ave
- 14-16 Cypress Ave
- 35 Maplewood Ave
- 1 Perry Ave
- 192 Lowell St
- 1146 Essex St
- 1100 Essex St
- 534 Forest St
- 1082 Essex St
- 7 Field Ave
- 750 Brookside Dr Unit G
- 11 Griffin St
- 16 Allen St
- 15 Griffin St
- 18 Allen St
- 14 Allen St
- 17&19 Griffin Street Extension
- 22 Allen St
- 23 Allen St
- 17 Griffin St
- 19 Allen St
- 26 Allen St
- 27 Allen St
- 31 Allen St
- 1101 Riverside Dr
- 1097 Riverside Dr
- 1111 Riverside Dr Unit 7-8
- 1111 Riverside Dr Unit 1
- 1111 Riverside Dr
- 1091 Riverside Dr
- 7 Noyes St
Your Personal Tour Guide
Ask me questions while you tour the home.