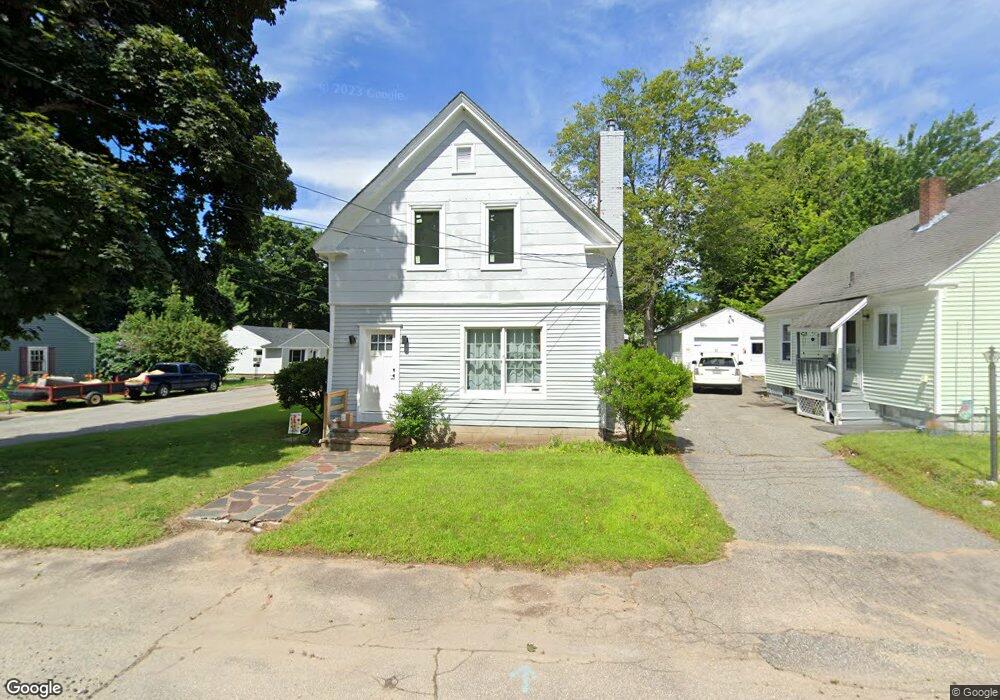
9 Grove St Sanford, ME 04073
Estimated Value: $342,000 - $405,000
3
Beds
3
Baths
1,765
Sq Ft
$208/Sq Ft
Est. Value
About This Home
This home is located at 9 Grove St, Sanford, ME 04073 and is currently estimated at $366,767, approximately $207 per square foot. 9 Grove St is a home located in York County with nearby schools including St Thomas Consolidated School and Sanford Christian Academy.
Ownership History
Date
Name
Owned For
Owner Type
Purchase Details
Closed on
Aug 14, 2008
Sold by
Gastonguay John
Bought by
Gastonguay John and Gastonguay Shannon I
Current Estimated Value
Home Financials for this Owner
Home Financials are based on the most recent Mortgage that was taken out on this home.
Original Mortgage
$208,075
Outstanding Balance
$135,889
Interest Rate
6.4%
Mortgage Type
FHA
Estimated Equity
$230,878
Purchase Details
Closed on
Feb 28, 2007
Sold by
Noble Mary Anne
Bought by
Gastonguay John
Home Financials for this Owner
Home Financials are based on the most recent Mortgage that was taken out on this home.
Original Mortgage
$157,920
Interest Rate
6.99%
Mortgage Type
FHA
Purchase Details
Closed on
Sep 7, 2006
Sold by
Meggison Susan L
Bought by
Meggison Michael and Meggison Susan L
Home Financials for this Owner
Home Financials are based on the most recent Mortgage that was taken out on this home.
Original Mortgage
$224,000
Interest Rate
6.79%
Mortgage Type
Purchase Money Mortgage
Create a Home Valuation Report for This Property
The Home Valuation Report is an in-depth analysis detailing your home's value as well as a comparison with similar homes in the area
Home Values in the Area
Average Home Value in this Area
Purchase History
| Date | Buyer | Sale Price | Title Company |
|---|---|---|---|
| Gastonguay John | -- | -- | |
| Gastonguay John | -- | -- | |
| Meggison Michael | -- | -- | |
| Meggison Michael | -- | -- |
Source: Public Records
Mortgage History
| Date | Status | Borrower | Loan Amount |
|---|---|---|---|
| Open | Meggison Michael | $208,075 | |
| Previous Owner | Meggison Michael | $157,920 | |
| Previous Owner | Meggison Michael | $39,480 | |
| Previous Owner | Meggison Michael | $224,000 |
Source: Public Records
Tax History Compared to Growth
Tax History
| Year | Tax Paid | Tax Assessment Tax Assessment Total Assessment is a certain percentage of the fair market value that is determined by local assessors to be the total taxable value of land and additions on the property. | Land | Improvement |
|---|---|---|---|---|
| 2025 | $4,478 | $261,900 | $40,300 | $221,600 |
| 2024 | $5,000 | $261,900 | $40,300 | $221,600 |
| 2023 | $3,935 | $259,900 | $40,300 | $219,600 |
| 2022 | $3,787 | $259,900 | $40,300 | $219,600 |
| 2021 | $3,671 | $208,800 | $40,300 | $168,500 |
| 2020 | $3,851 | $191,000 | $40,300 | $150,700 |
| 2019 | $3,434 | $165,900 | $40,300 | $125,600 |
| 2018 | $3,019 | $161,200 | $40,300 | $120,900 |
| 2017 | $3,194 | $154,000 | $40,300 | $113,700 |
| 2016 | $3,200 | $140,700 | $40,400 | $100,300 |
| 2015 | $3,019 | $137,000 | $41,400 | $95,600 |
| 2014 | $2,964 | $137,100 | $41,400 | $95,700 |
| 2013 | -- | $137,400 | $41,400 | $96,000 |
Source: Public Records
Map
Nearby Homes
- 5 Williams St
- 93 Lebanon St
- 31 Ridgeway Ave
- 17 Twombley Rd
- 5 Shaw St
- 33 Kimball St
- 29 River St
- 6 Dudley St
- 42 Spruce St
- 10 Bodwell St
- 18 Bodwell St
- 19 Bodwell St Unit 3
- 19 Bodwell St Unit 5
- 19 Bodwell St Unit 7
- 19 Bodwell St Unit 8
- 19 Bodwell St Unit 4
- 19 Bodwell St Unit 6
- 19 Bodwell St Unit 1
- 19 Bodwell St Unit 2
- 19 Bodwell St Unit 9