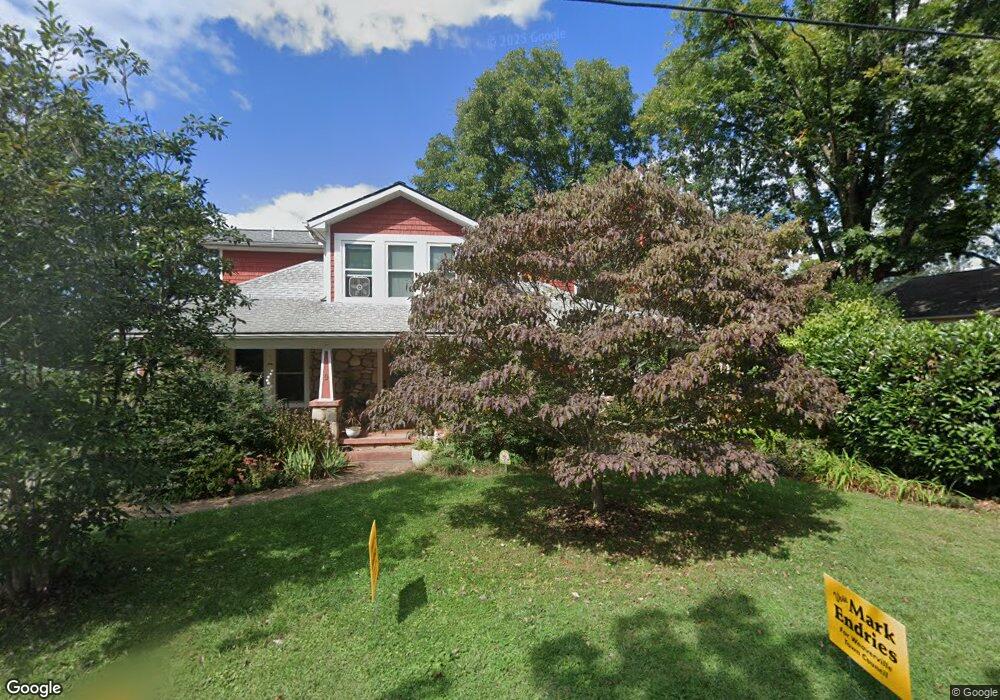
9 Grove St Weaverville, NC 28787
Estimated Value: $606,133 - $655,000
5
Beds
3
Baths
1,900
Sq Ft
$335/Sq Ft
Est. Value
About This Home
This home is located at 9 Grove St, Weaverville, NC 28787 and is currently estimated at $635,783, approximately $334 per square foot. 9 Grove St is a home located in Buncombe County with nearby schools including Weaverville Elementary, Weaverville Primary, and North Buncombe Middle.
Ownership History
Date
Name
Owned For
Owner Type
Purchase Details
Closed on
Oct 30, 2009
Sold by
9 Grove Street Llc
Bought by
Endries Mark J and Hale Rebecca E
Current Estimated Value
Home Financials for this Owner
Home Financials are based on the most recent Mortgage that was taken out on this home.
Original Mortgage
$220,000
Outstanding Balance
$143,945
Interest Rate
5.04%
Mortgage Type
New Conventional
Estimated Equity
$491,838
Purchase Details
Closed on
Dec 13, 2007
Sold by
Epstein Marci
Bought by
9 Grove Street Llc
Purchase Details
Closed on
Jun 25, 2004
Sold by
Goodrich Ruby C
Bought by
Epstein Marci
Home Financials for this Owner
Home Financials are based on the most recent Mortgage that was taken out on this home.
Original Mortgage
$100,000
Interest Rate
6.25%
Mortgage Type
Unknown
Purchase Details
Closed on
Nov 13, 2002
Sold by
Goodrich Ruby C
Bought by
Goodrich Ruby C and The Ruby C Goodrich Trust
Create a Home Valuation Report for This Property
The Home Valuation Report is an in-depth analysis detailing your home's value as well as a comparison with similar homes in the area
Home Values in the Area
Average Home Value in this Area
Purchase History
| Date | Buyer | Sale Price | Title Company |
|---|---|---|---|
| Endries Mark J | $275,000 | None Available | |
| 9 Grove Street Llc | -- | Chicago Title Insurance Co | |
| Epstein Marci | $135,000 | -- | |
| Goodrich Ruby C | -- | -- |
Source: Public Records
Mortgage History
| Date | Status | Borrower | Loan Amount |
|---|---|---|---|
| Open | Endries Mark J | $220,000 | |
| Previous Owner | Epstein Marci | $100,000 |
Source: Public Records
Tax History Compared to Growth
Tax History
| Year | Tax Paid | Tax Assessment Tax Assessment Total Assessment is a certain percentage of the fair market value that is determined by local assessors to be the total taxable value of land and additions on the property. | Land | Improvement |
|---|---|---|---|---|
| 2025 | $3,473 | $400,300 | $71,000 | $329,300 |
| 2024 | $3,473 | $400,300 | $71,000 | $329,300 |
| 2023 | $3,473 | $400,300 | $71,000 | $329,300 |
| 2022 | $3,355 | $400,300 | $0 | $0 |
| 2021 | $3,355 | $400,300 | $0 | $0 |
| 2020 | $3,193 | $351,300 | $0 | $0 |
| 2019 | $1,795 | $339,400 | $0 | $0 |
| 2018 | $1,801 | $339,400 | $0 | $0 |
| 2017 | $1,829 | $206,000 | $0 | $0 |
| 2016 | $1,244 | $206,000 | $0 | $0 |
| 2015 | $1,244 | $206,000 | $0 | $0 |
| 2014 | $1,244 | $206,000 | $0 | $0 |
Source: Public Records
Map
Nearby Homes