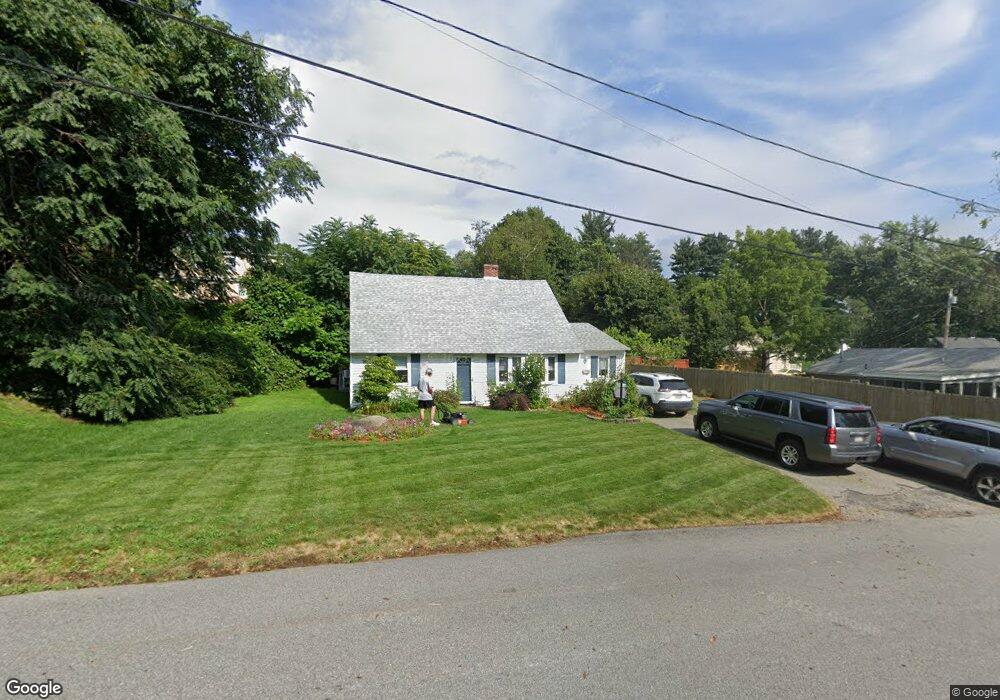
9 Hadley Rd Methuen, MA 01844
Downtown Methuen NeighborhoodEstimated Value: $512,000 - $570,000
3
Beds
2
Baths
1,752
Sq Ft
$308/Sq Ft
Est. Value
About This Home
This home is located at 9 Hadley Rd, Methuen, MA 01844 and is currently estimated at $540,078, approximately $308 per square foot. 9 Hadley Rd is a home located in Essex County with nearby schools including Tenney Grammar School, Methuen High School, and Saint Monica School.
Ownership History
Date
Name
Owned For
Owner Type
Purchase Details
Closed on
Aug 26, 1994
Sold by
Deady Kathleen M
Bought by
Kelly Thomas J
Current Estimated Value
Home Financials for this Owner
Home Financials are based on the most recent Mortgage that was taken out on this home.
Original Mortgage
$48,750
Interest Rate
8.65%
Mortgage Type
Purchase Money Mortgage
Create a Home Valuation Report for This Property
The Home Valuation Report is an in-depth analysis detailing your home's value as well as a comparison with similar homes in the area
Home Values in the Area
Average Home Value in this Area
Purchase History
| Date | Buyer | Sale Price | Title Company |
|---|---|---|---|
| Kelly Thomas J | $65,000 | -- | |
| Kelly Thomas J | $65,000 | -- |
Source: Public Records
Mortgage History
| Date | Status | Borrower | Loan Amount |
|---|---|---|---|
| Open | Kelly Thomas J | $228,400 | |
| Closed | Kelly Thomas J | $183,000 | |
| Closed | Kelly Thomas J | $27,000 | |
| Closed | Kelly Thomas J | $48,750 |
Source: Public Records
Tax History
| Year | Tax Paid | Tax Assessment Tax Assessment Total Assessment is a certain percentage of the fair market value that is determined by local assessors to be the total taxable value of land and additions on the property. | Land | Improvement |
|---|---|---|---|---|
| 2025 | $4,728 | $446,900 | $210,500 | $236,400 |
| 2024 | $4,652 | $428,400 | $192,000 | $236,400 |
| 2023 | $4,249 | $363,200 | $170,600 | $192,600 |
| 2022 | $4,013 | $307,500 | $142,200 | $165,300 |
| 2021 | $3,817 | $289,400 | $135,100 | $154,300 |
| 2020 | $3,830 | $285,000 | $135,100 | $149,900 |
| 2019 | $3,627 | $255,600 | $120,900 | $134,700 |
| 2018 | $3,556 | $249,200 | $120,900 | $128,300 |
| 2017 | $3,459 | $236,100 | $120,900 | $115,200 |
| 2016 | $3,229 | $218,000 | $113,800 | $104,200 |
| 2015 | $3,104 | $212,600 | $113,800 | $98,800 |
Source: Public Records
Map
Nearby Homes
- 82 Oakside Ave
- 2 Oak Knoll Rd
- 29 Center St
- 14 Buttonwood Dr
- 169 Berkeley St
- 9-11 Horne St
- 129-131 Lexington St
- 611 Prospect St
- 593 Prospect St
- 434-438 Hampshire St
- 23 Chase St
- 687 Jackson St
- 37 Albion St
- 24 Railroad St
- 2 Grove St
- 27 Willow St Unit A
- 7-9 Bennington St
- 20-22 Ashland Ave
- 46 Pelham St
- 36 Manchester St