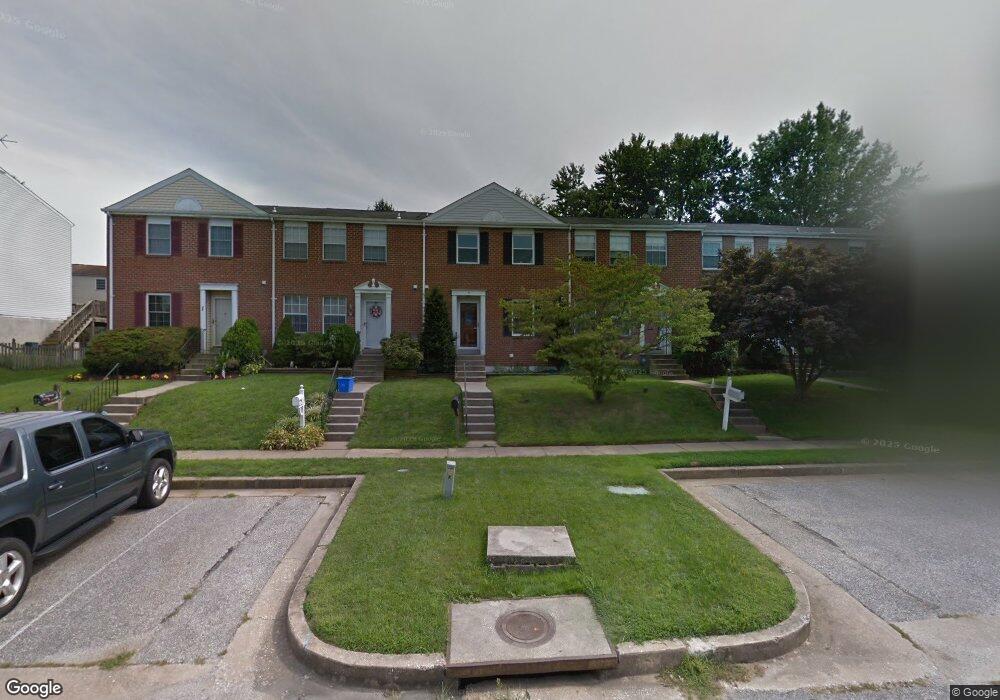
9 Hallview Ct Nottingham, MD 21236
Estimated Value: $271,000 - $313,000
Studio
3
Baths
1,280
Sq Ft
$229/Sq Ft
Est. Value
About This Home
This home is located at 9 Hallview Ct, Nottingham, MD 21236 and is currently estimated at $293,381, approximately $229 per square foot. 9 Hallview Ct is a home located in Baltimore County with nearby schools including Gunpowder Elementary School, Perry Hall Middle School, and Perry Hall High School.
Ownership History
Date
Name
Owned For
Owner Type
Purchase Details
Closed on
Nov 6, 2010
Sold by
Domingo John B
Bought by
Domingo John B and Domingo Cindy
Current Estimated Value
Home Financials for this Owner
Home Financials are based on the most recent Mortgage that was taken out on this home.
Original Mortgage
$100,000
Interest Rate
4.35%
Mortgage Type
New Conventional
Purchase Details
Closed on
Nov 21, 2002
Sold by
Linkowich Holly L
Bought by
Domingo John B
Purchase Details
Closed on
Dec 20, 2001
Sold by
Lijewski Brian S
Bought by
Linkowich Holly L
Purchase Details
Closed on
May 3, 1999
Sold by
Orndorff James D
Bought by
Lijewski Brian S and Guiou Francesca E
Create a Home Valuation Report for This Property
The Home Valuation Report is an in-depth analysis detailing your home's value as well as a comparison with similar homes in the area
Home Values in the Area
Average Home Value in this Area
Purchase History
| Date | Buyer | Sale Price | Title Company |
|---|---|---|---|
| Domingo John B | -- | None Available | |
| Domingo John B | $137,000 | -- | |
| Linkowich Holly L | $123,000 | -- | |
| Lijewski Brian S | $106,900 | -- |
Source: Public Records
Mortgage History
| Date | Status | Borrower | Loan Amount |
|---|---|---|---|
| Closed | Domingo John B | $100,000 |
Source: Public Records
Tax History
| Year | Tax Paid | Tax Assessment Tax Assessment Total Assessment is a certain percentage of the fair market value that is determined by local assessors to be the total taxable value of land and additions on the property. | Land | Improvement |
|---|---|---|---|---|
| 2025 | $3,630 | $239,000 | -- | -- |
| 2024 | $3,630 | $223,900 | $0 | $0 |
| 2023 | $3,400 | $208,800 | $70,000 | $138,800 |
| 2022 | $2,865 | $205,333 | $0 | $0 |
| 2021 | $3,093 | $201,867 | $0 | $0 |
| 2020 | $3,093 | $198,400 | $70,000 | $128,400 |
| 2019 | $2,908 | $193,667 | $0 | $0 |
| 2018 | $2,982 | $188,933 | $0 | $0 |
| 2017 | $2,865 | $184,200 | $0 | $0 |
| 2016 | $2,294 | $182,800 | $0 | $0 |
| 2015 | $2,294 | $181,400 | $0 | $0 |
| 2014 | $2,294 | $180,000 | $0 | $0 |
Source: Public Records
Map
Nearby Homes
- 32 Stoneway Place
- 48 Stoneway Place
- 14 Powderock Place
- 1 Bellhurst Way
- 37 Gunfalls Garth
- 28 Sandstone Ct
- 3803 Proctor Ln
- 3827 Proctor Ln
- 9422 Gunview Rd
- 9331 Oak White Rd
- 32 Romanoff Ct
- 36 Romanoff Ct
- 37 Beagle Run
- 9405 Perglen Rd
- 150 Jumpers Cir
- 7 Medici Ct
- 9905 Magledt Rd
- 139 Bourbon Ct
- 4004 Milner Rd
- 4010 Milner Rd
- 7 Hallview Ct
- 11 Hallview Ct
- 5 Hallview Ct
- 13 Hallview Ct
- 3 Hallview Ct
- 15 Hallview Ct
- 17 Hallview Ct
- 19 Hallview Ct
- 14 Bellrock Ct
- 12 Bellrock Ct
- 10 Bellrock Ct
- 16 Bellrock Ct
- 8 Bellrock Ct
- 9515 Hickoryhurst Dr
- 21 Hallview Ct
- 18 Bellrock Ct
- 6 Bellrock Ct
- 9513 Hickoryhurst Dr
- 20 Bellrock Ct
- 23 Hallview Ct
Your Personal Tour Guide
Ask me questions while you tour the home.