9 Hampton Rd Flanders, NJ 07836
Estimated Value: $526,000 - $553,462
Studio
--
Bath
1,580
Sq Ft
$343/Sq Ft
Est. Value
About This Home
This home is located at 9 Hampton Rd, Flanders, NJ 07836 and is currently estimated at $542,366, approximately $343 per square foot. 9 Hampton Rd is a home located in Morris County with nearby schools including Mt Olive Middle School, Mount Olive High School, and American Christian School.
Ownership History
Date
Name
Owned For
Owner Type
Purchase Details
Closed on
Feb 13, 2009
Sold by
Gwinnett Ronald and Gwinnett Margaret
Bought by
Heien Steven
Current Estimated Value
Home Financials for this Owner
Home Financials are based on the most recent Mortgage that was taken out on this home.
Original Mortgage
$230,000
Outstanding Balance
$145,076
Interest Rate
5.06%
Mortgage Type
Purchase Money Mortgage
Estimated Equity
$397,290
Purchase Details
Closed on
Apr 28, 2006
Sold by
Gresack Sandra
Bought by
Gwinnett Ronald W
Create a Home Valuation Report for This Property
The Home Valuation Report is an in-depth analysis detailing your home's value as well as a comparison with similar homes in the area
Home Values in the Area
Average Home Value in this Area
Purchase History
| Date | Buyer | Sale Price | Title Company |
|---|---|---|---|
| Heien Steven | $340,000 | Chicago Title Insurance Co | |
| Gwinnett Ronald W | $425,000 | -- |
Source: Public Records
Mortgage History
| Date | Status | Borrower | Loan Amount |
|---|---|---|---|
| Open | Heien Steven | $230,000 |
Source: Public Records
Tax History
| Year | Tax Paid | Tax Assessment Tax Assessment Total Assessment is a certain percentage of the fair market value that is determined by local assessors to be the total taxable value of land and additions on the property. | Land | Improvement |
|---|---|---|---|---|
| 2025 | $9,584 | $275,000 | $172,900 | $102,100 |
| 2024 | $9,039 | $275,000 | $172,900 | $102,100 |
| 2023 | $9,039 | $275,000 | $172,900 | $102,100 |
| 2022 | $9,235 | $275,000 | $172,900 | $102,100 |
| 2021 | $9,111 | $275,000 | $172,900 | $102,100 |
| 2020 | $9,111 | $275,000 | $172,900 | $102,100 |
| 2019 | $9,081 | $275,000 | $172,900 | $102,100 |
| 2018 | $8,993 | $275,000 | $172,900 | $102,100 |
| 2017 | $8,836 | $275,000 | $172,900 | $102,100 |
| 2016 | $8,555 | $275,000 | $172,900 | $102,100 |
| 2015 | $8,756 | $275,000 | $172,900 | $102,100 |
| 2014 | $8,764 | $275,000 | $172,900 | $102,100 |
Source: Public Records
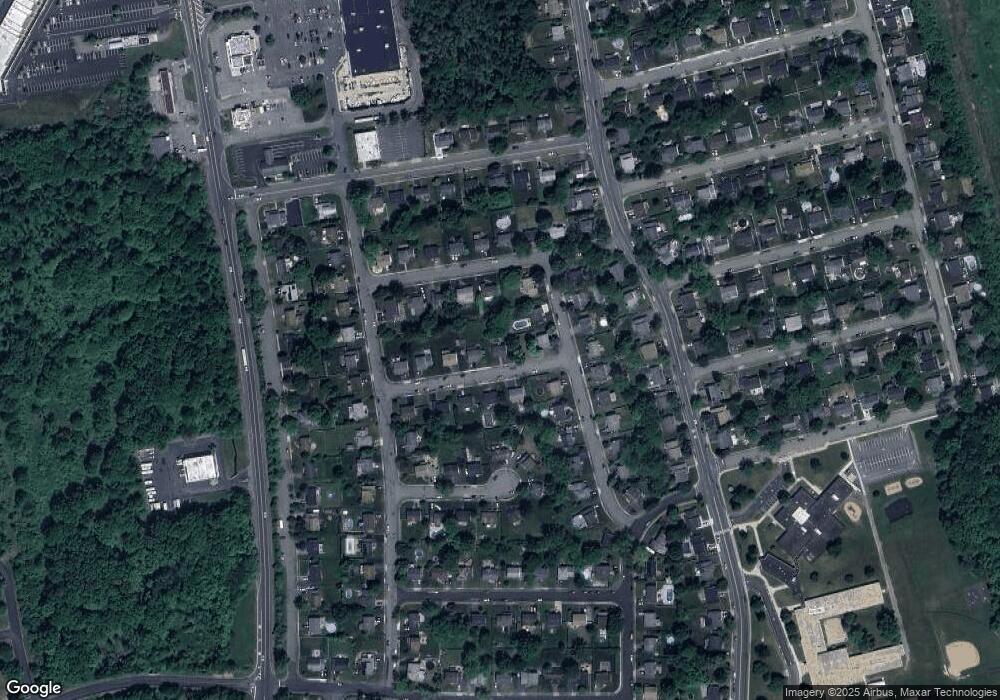
Map
Nearby Homes
Your Personal Tour Guide
Ask me questions while you tour the home.