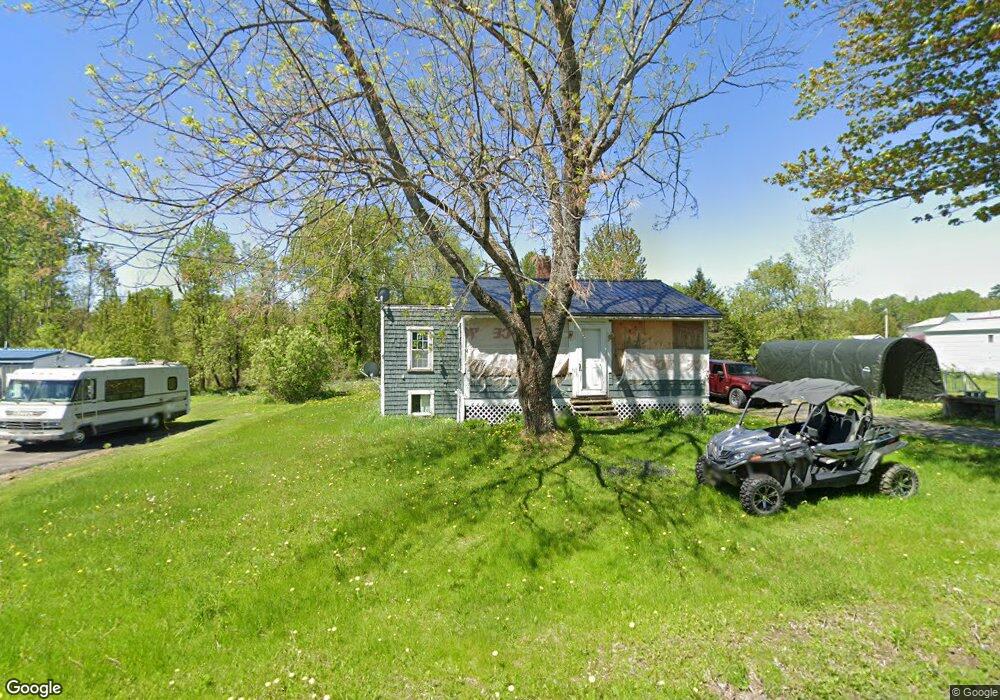
9 Hancock St Dover Foxcroft, ME 04426
Estimated Value: $161,342 - $234,000
2
Beds
1
Bath
794
Sq Ft
$263/Sq Ft
Est. Value
About This Home
This home is located at 9 Hancock St, Dover Foxcroft, ME 04426 and is currently estimated at $209,086, approximately $263 per square foot. 9 Hancock St is a home located in Piscataquis County with nearby schools including Se Do Mo Cha Elementary School, Se Do Mo Cha Middle School, and Foxcroft Academy.
Ownership History
Date
Name
Owned For
Owner Type
Purchase Details
Closed on
Jun 28, 2019
Sold by
Waterhouse Karly R and Stevens Robert A
Bought by
Grass Dana A
Current Estimated Value
Home Financials for this Owner
Home Financials are based on the most recent Mortgage that was taken out on this home.
Original Mortgage
$55,555
Outstanding Balance
$48,850
Interest Rate
4%
Mortgage Type
New Conventional
Estimated Equity
$160,236
Purchase Details
Closed on
Oct 2, 2006
Sold by
Hutchinson Penny J
Bought by
Waterhouse Karly R
Home Financials for this Owner
Home Financials are based on the most recent Mortgage that was taken out on this home.
Original Mortgage
$55,200
Interest Rate
6.52%
Mortgage Type
Commercial
Create a Home Valuation Report for This Property
The Home Valuation Report is an in-depth analysis detailing your home's value as well as a comparison with similar homes in the area
Home Values in the Area
Average Home Value in this Area
Purchase History
| Date | Buyer | Sale Price | Title Company |
|---|---|---|---|
| Grass Dana A | -- | -- | |
| Waterhouse Karly R | -- | -- |
Source: Public Records
Mortgage History
| Date | Status | Borrower | Loan Amount |
|---|---|---|---|
| Open | Grass Dana A | $55,555 | |
| Previous Owner | Waterhouse Karly R | $55,200 |
Source: Public Records
Tax History Compared to Growth
Tax History
| Year | Tax Paid | Tax Assessment Tax Assessment Total Assessment is a certain percentage of the fair market value that is determined by local assessors to be the total taxable value of land and additions on the property. | Land | Improvement |
|---|---|---|---|---|
| 2024 | $1,739 | $102,300 | $13,300 | $89,000 |
| 2023 | $1,553 | $83,700 | $12,300 | $71,400 |
| 2022 | $1,472 | $73,600 | $11,200 | $62,400 |
| 2021 | $1,475 | $68,600 | $10,200 | $58,400 |
| 2020 | $1,468 | $68,600 | $10,200 | $58,400 |
| 2019 | $1,357 | $63,100 | $10,200 | $52,900 |
| 2018 | $1,338 | $63,100 | $10,200 | $52,900 |
| 2017 | $1,319 | $63,100 | $10,200 | $52,900 |
| 2016 | $1,278 | $63,100 | $10,200 | $52,900 |
| 2015 | $1,174 | $63,100 | $10,200 | $52,900 |
| 2014 | $1,152 | $63,100 | $10,200 | $52,900 |
| 2013 | $1,114 | $63,100 | $10,200 | $52,900 |
Source: Public Records
Map
Nearby Homes