Estimated Value: $928,054 - $1,000,000
4
Beds
3
Baths
2,903
Sq Ft
$333/Sq Ft
Est. Value
About This Home
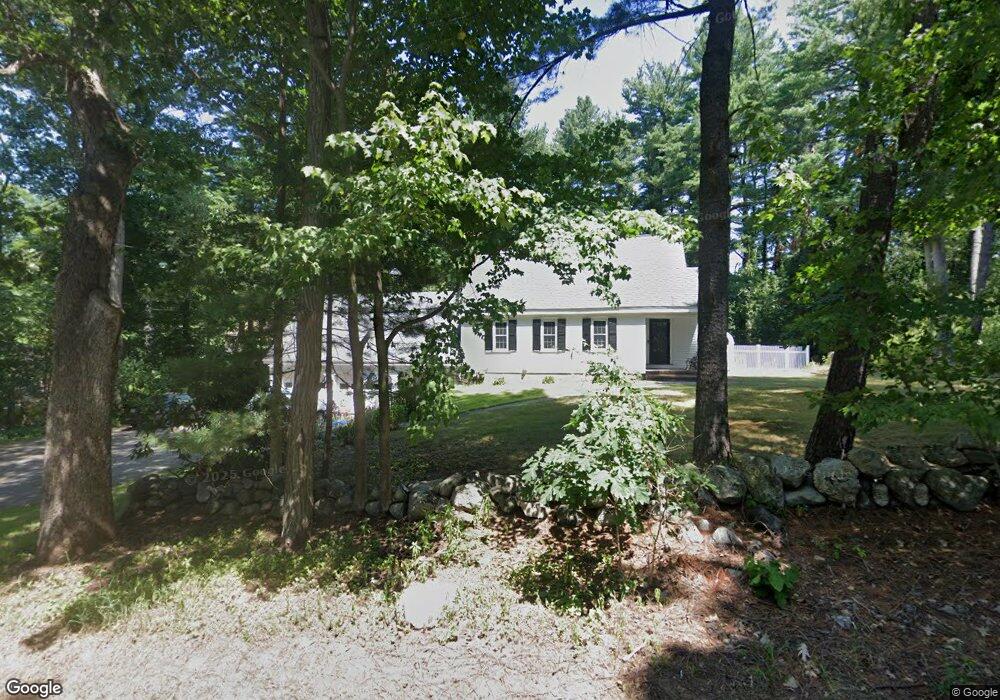
This home is located at 9 Hayward Rd, Acton, MA 01720 and is currently estimated at $965,264, approximately $332 per square foot. 9 Hayward Rd is a home located in Middlesex County with nearby schools including Acton-Boxborough Regional High School, Maynard Knowledge Beginnings, and The Imago School.
Ownership History
Date
Name
Owned For
Owner Type
Purchase Details
Closed on
Sep 9, 2024
Sold by
Belseth Andrew C and Belseth Shannon
Bought by
Belseth Ft and Belseth
Current Estimated Value
Purchase Details
Closed on
Nov 19, 2022
Sold by
Belseth Sharon C Est and Belseth
Bought by
Belseth Andrew C and Belseth Shannon
Purchase Details
Closed on
May 16, 1986
Bought by
Belseth Donald R
Create a Home Valuation Report for This Property
The Home Valuation Report is an in-depth analysis detailing your home's value as well as a comparison with similar homes in the area
Home Values in the Area
Average Home Value in this Area
Purchase History
| Date | Buyer | Sale Price | Title Company |
|---|---|---|---|
| Belseth Ft | -- | None Available | |
| Belseth Ft | -- | None Available | |
| Belseth Andrew C | -- | None Available | |
| Belseth Andrew C | -- | None Available | |
| Belseth Donald R | $223,000 | -- |
Source: Public Records
Mortgage History
| Date | Status | Borrower | Loan Amount |
|---|---|---|---|
| Previous Owner | Belseth Donald R | $136,000 | |
| Previous Owner | Belseth Donald R | $125,000 |
Source: Public Records
Tax History
| Year | Tax Paid | Tax Assessment Tax Assessment Total Assessment is a certain percentage of the fair market value that is determined by local assessors to be the total taxable value of land and additions on the property. | Land | Improvement |
|---|---|---|---|---|
| 2025 | $12,537 | $731,000 | $276,500 | $454,500 |
| 2024 | $11,799 | $707,800 | $276,500 | $431,300 |
| 2023 | $11,990 | $682,800 | $251,500 | $431,300 |
| 2022 | $10,960 | $563,500 | $218,500 | $345,000 |
| 2021 | $10,588 | $523,400 | $202,400 | $321,000 |
| 2020 | $9,749 | $506,700 | $202,400 | $304,300 |
| 2019 | $9,474 | $489,100 | $202,400 | $286,700 |
| 2018 | $9,287 | $479,200 | $202,400 | $276,800 |
| 2017 | $9,301 | $488,000 | $202,400 | $285,600 |
| 2016 | $8,746 | $454,800 | $202,400 | $252,400 |
| 2015 | $8,569 | $449,800 | $202,400 | $247,400 |
| 2014 | $8,311 | $427,300 | $202,400 | $224,900 |
Source: Public Records
Map
Nearby Homes
- 18 Hayward Rd
- 11 Braebrook
- 46 Taylor Rd
- 491 Main St
- 79 Charter Rd
- 33 Meadowbrook Rd
- 27 Forest Rd
- 246 Main St Unit 2
- 7 Kelley Rd
- 709 Main St
- 524 Main St
- 25 Nylander Way
- 70 River St
- 129 Main St Unit 129
- 131 Main St
- 8 Algonquin Rd
- 187 Great Rd Unit A1
- 285 Central St Unit 285
- 19 Railroad St Unit D2
- 19 Railroad St Unit C2
Your Personal Tour Guide
Ask me questions while you tour the home.