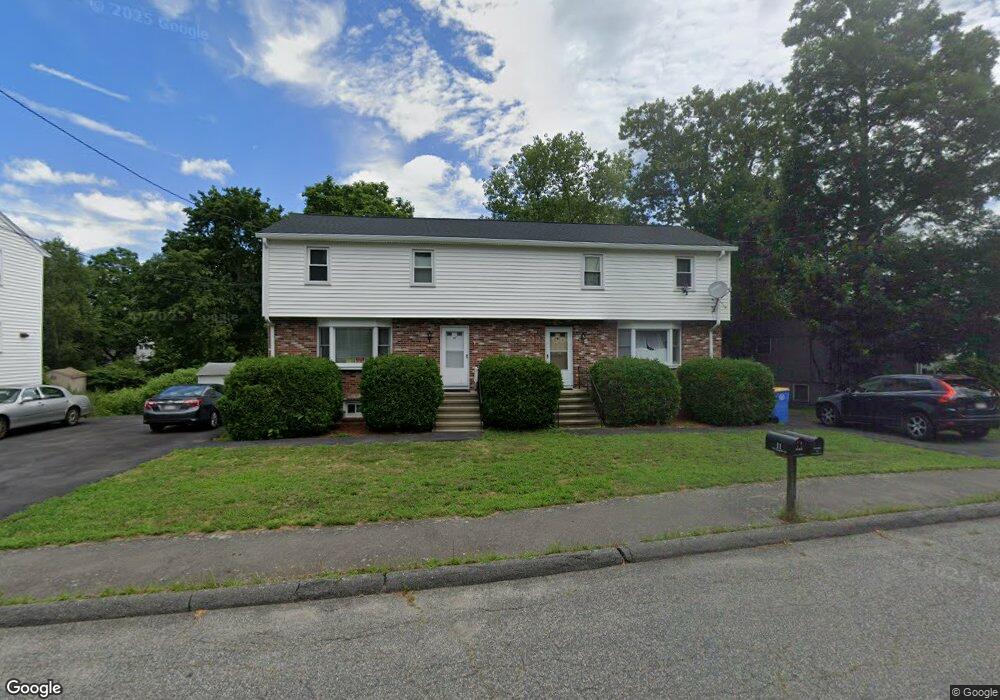
9 Hayward St Unit 11 Randolph, MA 02368
Downtown Randolph NeighborhoodEstimated Value: $763,181 - $972,000
6
Beds
4
Baths
2,600
Sq Ft
$346/Sq Ft
Est. Value
About This Home
This home is located at 9 Hayward St Unit 11, Randolph, MA 02368 and is currently estimated at $898,795, approximately $345 per square foot. 9 Hayward St Unit 11 is a home located in Norfolk County with nearby schools including Randolph High School, Boston Higashi School, and Lighthouse Baptist Christian Academy.
Ownership History
Date
Name
Owned For
Owner Type
Purchase Details
Closed on
May 20, 2021
Sold by
Wong Att Y and Wong Lai N
Bought by
Wong Ft
Current Estimated Value
Purchase Details
Closed on
Apr 8, 2021
Sold by
Wong Kevin C
Bought by
Wong Att Y and Wong Lai N
Purchase Details
Closed on
Jan 21, 2020
Sold by
Wong Ft
Bought by
Wong Ft
Purchase Details
Closed on
Oct 26, 2016
Sold by
Wong Att Y and Kwan-Wong Lai N
Bought by
Wong Rt
Purchase Details
Closed on
Mar 7, 2016
Sold by
Wong Ft and Wong Att Y
Bought by
Wong Att Y and Kwan-Wong Lai N
Home Financials for this Owner
Home Financials are based on the most recent Mortgage that was taken out on this home.
Original Mortgage
$230,000
Interest Rate
3.81%
Mortgage Type
New Conventional
Purchase Details
Closed on
Sep 28, 2015
Sold by
Wong Att Y and Wong Lai N
Bought by
Wong Ft and Wong Att Y
Create a Home Valuation Report for This Property
The Home Valuation Report is an in-depth analysis detailing your home's value as well as a comparison with similar homes in the area
Home Values in the Area
Average Home Value in this Area
Purchase History
| Date | Buyer | Sale Price | Title Company |
|---|---|---|---|
| Wong Ft | -- | None Available | |
| Wong Att Y | -- | None Available | |
| Wong Kevin C | -- | None Available | |
| Wong Ft | -- | None Available | |
| Wong Rt | -- | -- | |
| Wong Att Y | -- | -- | |
| Wong Ft | -- | -- |
Source: Public Records
Mortgage History
| Date | Status | Borrower | Loan Amount |
|---|---|---|---|
| Previous Owner | Wong Att Y | $230,000 |
Source: Public Records
Tax History
| Year | Tax Paid | Tax Assessment Tax Assessment Total Assessment is a certain percentage of the fair market value that is determined by local assessors to be the total taxable value of land and additions on the property. | Land | Improvement |
|---|---|---|---|---|
| 2025 | $9,356 | $805,900 | $262,800 | $543,100 |
| 2024 | $8,612 | $752,100 | $257,700 | $494,400 |
| 2023 | $8,002 | $662,400 | $234,300 | $428,100 |
| 2022 | $7,636 | $561,500 | $195,300 | $366,200 |
| 2021 | $8,113 | $548,900 | $162,800 | $386,100 |
| 2020 | $7,722 | $517,900 | $162,800 | $355,100 |
| 2019 | $7,532 | $502,800 | $155,000 | $347,800 |
| 2018 | $6,911 | $435,200 | $140,900 | $294,300 |
| 2017 | $6,781 | $419,100 | $134,100 | $285,000 |
| 2016 | $6,226 | $358,000 | $121,800 | $236,200 |
| 2015 | $5,872 | $324,400 | $116,100 | $208,300 |
Source: Public Records
Map
Nearby Homes
- 158 Union St
- 217 Mill St
- 229 Mill St
- 249 Mill St
- 327 Union St
- 10 Alfred Terrace
- 1 Young Terrace
- 23 Nightingale Cir
- 7 Van Beal Rd
- 28 Mcdonnell Dr
- 6 Eagle Rd
- 5 Patterson Ave E
- 20 Isabelle Ave
- 276 Center St
- 120 Roberts Ave
- 15 Hillsdale Rd
- 20 Selwyn Rd
- 33 Hemlock Terrace
- 5 Clarendon Cir Unit Lot 4
- 14 Washington Cir
- 9 Hayward St Unit 9
- 7 Hayward St
- 15 Hayward St Unit 17
- 14 Hayward St
- 10 Hayward St
- 18 Prospect Ave
- 12 Hayward St
- 16 Hayward St
- 18 Hayward St
- 3 Hayward St
- 1 Hayward St
- 1 Hayward St Unit A,1
- 16 Prospect Ave
- 23 Hayward St
- 23 Hayward St Unit 23,23
- 21 Hayward St
- 21 Hayward St Unit R
- 19 Petipas Ln
- 19 Petipas Ln Unit 19 Petipas
- 20 Hayward St Unit 22
Your Personal Tour Guide
Ask me questions while you tour the home.