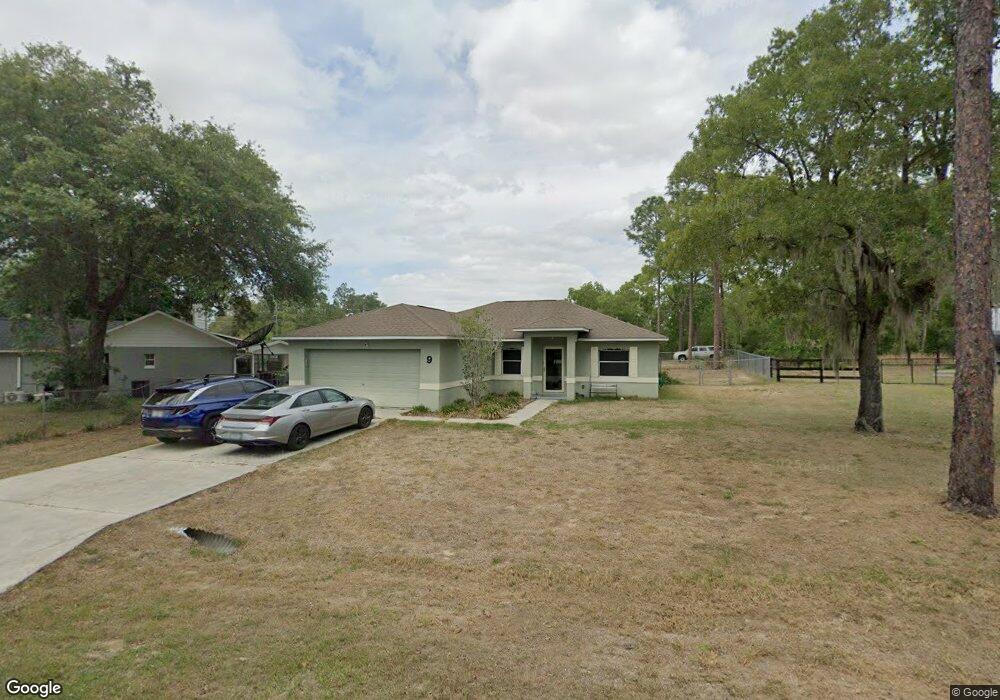
9 Hemlock Loop Trail Ocala, FL 34472
Silver Spring Shores NeighborhoodEstimated Value: $228,000 - $272,000
3
Beds
2
Baths
1,398
Sq Ft
$174/Sq Ft
Est. Value
About This Home
This home is located at 9 Hemlock Loop Trail, Ocala, FL 34472 and is currently estimated at $243,840, approximately $174 per square foot. 9 Hemlock Loop Trail is a home located in Marion County with nearby schools including Greenway Elementary School, Lake Weir Middle School, and Lake Weir High School.
Ownership History
Date
Name
Owned For
Owner Type
Purchase Details
Closed on
Sep 14, 2016
Sold by
Lithgow Robert
Bought by
Mcdonald Barbara A and Mcdonald Gerald Edward
Current Estimated Value
Home Financials for this Owner
Home Financials are based on the most recent Mortgage that was taken out on this home.
Original Mortgage
$115,000
Outstanding Balance
$91,107
Interest Rate
3.43%
Mortgage Type
New Conventional
Estimated Equity
$152,733
Purchase Details
Closed on
May 26, 2010
Sold by
Golding Aird Karen
Bought by
Lithgow Robert
Purchase Details
Closed on
Nov 9, 2005
Sold by
Dejoie Jospeh and Dejoie Natalie
Bought by
Golding Aird Karen
Create a Home Valuation Report for This Property
The Home Valuation Report is an in-depth analysis detailing your home's value as well as a comparison with similar homes in the area
Home Values in the Area
Average Home Value in this Area
Purchase History
| Date | Buyer | Sale Price | Title Company |
|---|---|---|---|
| Mcdonald Barbara A | $115,000 | 1St Quality Title Llc | |
| Lithgow Robert | $62,500 | Town & Country Title Guarant | |
| Golding Aird Karen | $47,500 | Aaa Quality Title Services & | |
| Dejoie Joseph R | $23,642 | Aaa Quality Title Services & |
Source: Public Records
Mortgage History
| Date | Status | Borrower | Loan Amount |
|---|---|---|---|
| Open | Mcdonald Barbara A | $115,000 |
Source: Public Records
Tax History
| Year | Tax Paid | Tax Assessment Tax Assessment Total Assessment is a certain percentage of the fair market value that is determined by local assessors to be the total taxable value of land and additions on the property. | Land | Improvement |
|---|---|---|---|---|
| 2025 | $1,721 | $120,500 | -- | -- |
| 2024 | $1,480 | $117,104 | -- | -- |
| 2023 | $1,432 | $113,389 | $0 | $0 |
| 2022 | $1,386 | $110,086 | $0 | $0 |
| 2021 | $1,374 | $106,880 | $0 | $0 |
| 2020 | $1,359 | $105,404 | $0 | $0 |
| 2019 | $1,333 | $103,034 | $0 | $0 |
| 2018 | $1,269 | $101,113 | $0 | $0 |
| 2017 | $1,234 | $98,437 | $5,500 | $92,937 |
| 2016 | $869 | $67,165 | $0 | $0 |
| 2015 | $870 | $66,698 | $0 | $0 |
| 2014 | $830 | $66,169 | $0 | $0 |
Source: Public Records
Map
Nearby Homes
- TBD Hemlock Loop Dr
- 10 Hemlock Court Pass
- 7 Hemlock Way
- 000 Midway Terrace
- 7217 Hemlock Loop
- 7473 Hemlock Rd
- 0 Pine Trace Run Unit OM639872
- 33 Hemlock Ln
- 6 Pine Trace Ln
- 0 Hemlock Course Unit MFRO6382845
- 8 Pine Trace Ln
- 18 Midway Ct
- 5 Cedar Trace Ln
- Lot 37 Cedar Trace Ln
- 9007-0090-15 Bahia Pass Ct
- 13 Hemlock Trace Ct
- TBD Midway Ct
- 4 Cedar Trace Way
- 12 Pine Trace Terrace
- 7013 SE Maricamp Rd
- 7243 Hemlock Loop
- 8 Hemlock Loop Dr
- 0 Hemlock Loop Trail
- 7237 Hemlock Loop
- 5 Hemlock Loop Trail
- 6 Hemlock Loop Dr
- 9 Hemlock Loop Pass
- 7 Hemlock Loop Pass
- 16 Hemlock Court Pass
- 7 Hemlock Loop Dr
- 14 Hemlock Court Pass
- 11 Hemlock Loop Pass
- 3 Hemlock Loop Trail
- 15 Hemlock Loop Dr
- 20 Hemlock Court Pass
- 10 Hemlock Court Pass
- 4 Hemlock Loop Trail
- 22 Hemlock Court Pass
- 0 Hemlock Court Pass
- 8 Hemlock Loop Run
Your Personal Tour Guide
Ask me questions while you tour the home.