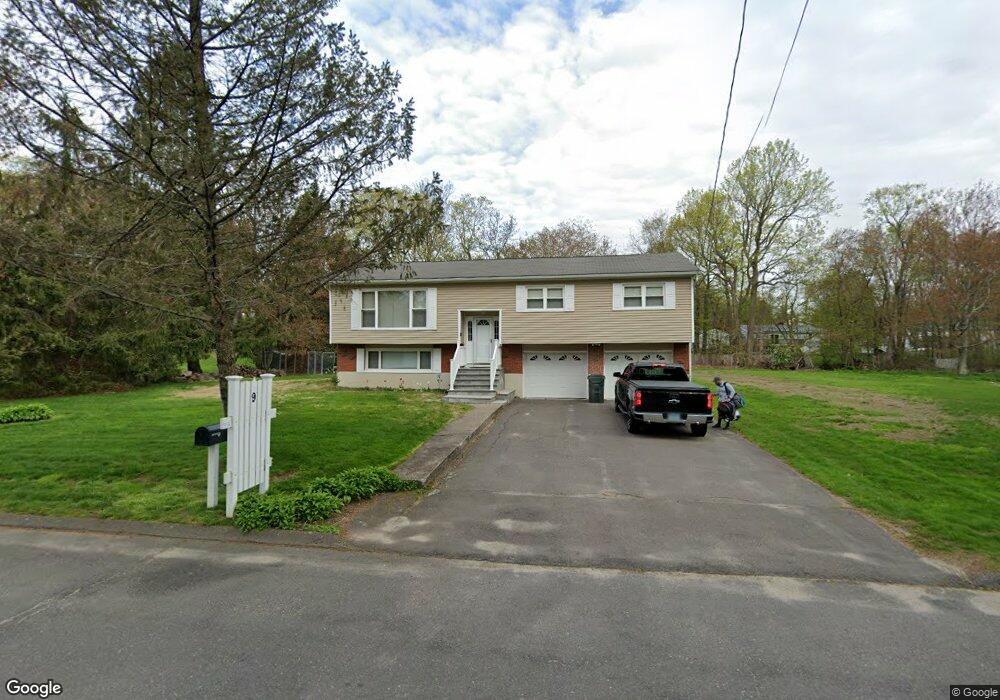
9 Highland Dr Prospect, CT 06712
Estimated Value: $393,000 - $447,000
3
Beds
3
Baths
1,288
Sq Ft
$328/Sq Ft
Est. Value
About This Home
This home is located at 9 Highland Dr, Prospect, CT 06712 and is currently estimated at $422,324, approximately $327 per square foot. 9 Highland Dr is a home located in New Haven County with nearby schools including Prospect Elementary School, Long River Middle School, and Woodland Regional High School.
Ownership History
Date
Name
Owned For
Owner Type
Purchase Details
Closed on
Jun 24, 2015
Sold by
Fnma
Bought by
Corden John D
Current Estimated Value
Home Financials for this Owner
Home Financials are based on the most recent Mortgage that was taken out on this home.
Original Mortgage
$176,000
Outstanding Balance
$136,753
Interest Rate
3.84%
Estimated Equity
$285,571
Purchase Details
Closed on
Nov 3, 2014
Sold by
Wells Fargo Bank Na
Bought by
Fnma
Purchase Details
Closed on
Oct 3, 2006
Sold by
Fernandez Lino and Fernandez Celia
Bought by
Doda Fatmir and Doda Emirjana
Home Financials for this Owner
Home Financials are based on the most recent Mortgage that was taken out on this home.
Original Mortgage
$256,000
Interest Rate
6.52%
Create a Home Valuation Report for This Property
The Home Valuation Report is an in-depth analysis detailing your home's value as well as a comparison with similar homes in the area
Home Values in the Area
Average Home Value in this Area
Purchase History
| Date | Buyer | Sale Price | Title Company |
|---|---|---|---|
| Corden John D | $220,000 | -- | |
| Fnma | -- | -- | |
| Fnma | -- | -- | |
| Wells Fargo Bank Na | -- | -- | |
| Doda Fatmir | $320,000 | -- |
Source: Public Records
Mortgage History
| Date | Status | Borrower | Loan Amount |
|---|---|---|---|
| Open | Doda Fatmir | $176,000 | |
| Previous Owner | Doda Fatmir | $256,000 | |
| Previous Owner | Doda Fatmir | $47,705 |
Source: Public Records
Tax History Compared to Growth
Tax History
| Year | Tax Paid | Tax Assessment Tax Assessment Total Assessment is a certain percentage of the fair market value that is determined by local assessors to be the total taxable value of land and additions on the property. | Land | Improvement |
|---|---|---|---|---|
| 2025 | $6,487 | $253,680 | $85,190 | $168,490 |
| 2024 | $5,652 | $175,870 | $85,150 | $90,720 |
| 2023 | $5,614 | $175,870 | $85,150 | $90,720 |
| 2022 | $5,619 | $175,870 | $85,150 | $90,720 |
| 2021 | $5,681 | $175,870 | $85,150 | $90,720 |
| 2020 | $5,527 | $174,900 | $85,160 | $89,740 |
| 2019 | $5,413 | $174,900 | $85,160 | $89,740 |
| 2018 | $5,422 | $174,900 | $85,160 | $89,740 |
| 2017 | $5,466 | $174,900 | $85,160 | $89,740 |
| 2016 | $5,231 | $174,900 | $85,160 | $89,740 |
| 2015 | $5,109 | $174,770 | $85,150 | $89,620 |
| 2014 | $5,065 | $174,770 | $85,150 | $89,620 |
Source: Public Records
Map
Nearby Homes