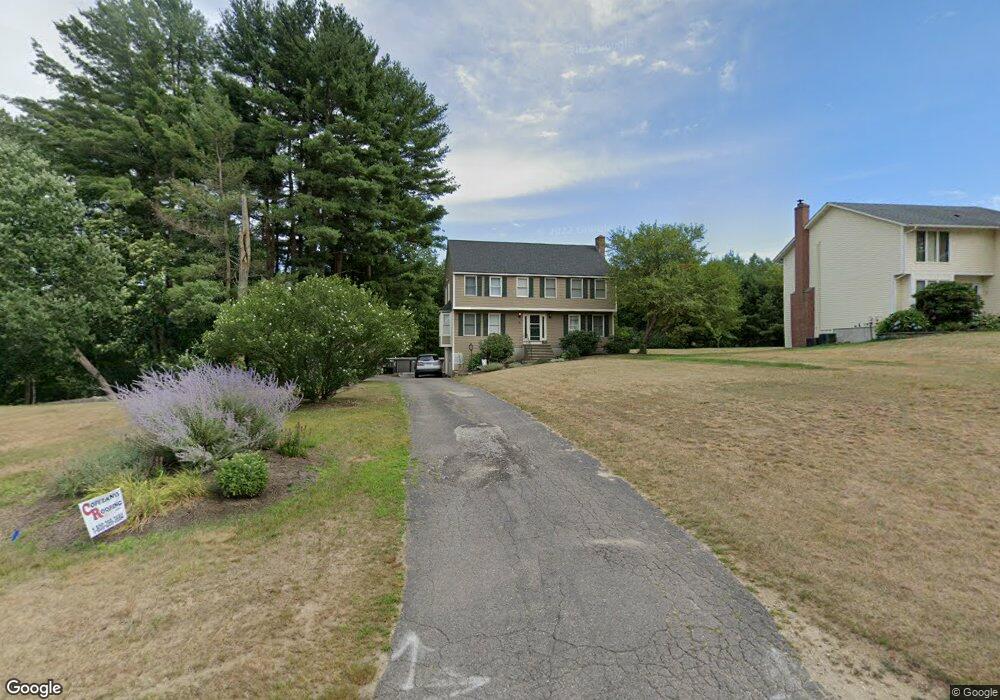
9 Holbrook St Medway, MA 02053
Estimated Value: $629,000 - $949,000
4
Beds
3
Baths
2,352
Sq Ft
$324/Sq Ft
Est. Value
About This Home
This home is located at 9 Holbrook St, Medway, MA 02053 and is currently estimated at $762,772, approximately $324 per square foot. 9 Holbrook St is a home located in Norfolk County with nearby schools including John D. McGovern Elementary School, Burke-Memorial Elementary, and Medway Middle School.
Ownership History
Date
Name
Owned For
Owner Type
Purchase Details
Closed on
Jul 11, 2001
Sold by
Ozella Anthony M
Bought by
Farley Frank J and Farley Vanessa O
Current Estimated Value
Home Financials for this Owner
Home Financials are based on the most recent Mortgage that was taken out on this home.
Original Mortgage
$150,000
Outstanding Balance
$58,058
Interest Rate
7.2%
Mortgage Type
Purchase Money Mortgage
Estimated Equity
$704,714
Create a Home Valuation Report for This Property
The Home Valuation Report is an in-depth analysis detailing your home's value as well as a comparison with similar homes in the area
Home Values in the Area
Average Home Value in this Area
Purchase History
| Date | Buyer | Sale Price | Title Company |
|---|---|---|---|
| Farley Frank J | $205,000 | -- |
Source: Public Records
Mortgage History
| Date | Status | Borrower | Loan Amount |
|---|---|---|---|
| Open | Farley Frank J | $150,000 | |
| Previous Owner | Farley Frank J | $152,100 |
Source: Public Records
Tax History
| Year | Tax Paid | Tax Assessment Tax Assessment Total Assessment is a certain percentage of the fair market value that is determined by local assessors to be the total taxable value of land and additions on the property. | Land | Improvement |
|---|---|---|---|---|
| 2025 | $9,140 | $641,400 | $309,800 | $331,600 |
| 2024 | $9,236 | $641,400 | $309,800 | $331,600 |
| 2023 | $9,169 | $575,200 | $282,000 | $293,200 |
| 2022 | $8,035 | $474,600 | $208,500 | $266,100 |
| 2021 | $7,798 | $446,600 | $194,600 | $252,000 |
| 2020 | $7,639 | $436,500 | $194,600 | $241,900 |
| 2019 | $7,205 | $424,600 | $186,700 | $237,900 |
| 2018 | $7,251 | $410,600 | $178,800 | $231,800 |
| 2017 | $7,378 | $411,700 | $184,000 | $227,700 |
| 2016 | $7,190 | $397,000 | $169,300 | $227,700 |
| 2015 | $7,221 | $395,900 | $167,300 | $228,600 |
| 2014 | $6,965 | $369,700 | $167,300 | $202,400 |
Source: Public Records
Map
Nearby Homes
- 3 Millbrook Rd
- 15 Fox Run Rd
- 4 Beech St
- 462 Hartford Ave
- 42 Fisher St
- 56 Fisher St
- 28 Fisher St
- 2 Kingson Ln Unit 2
- 394 Village St
- 6 Freedom Trail
- 22 Milford St
- 4 Linda Ln
- 8 Liberty Rd
- 8 Apache Rd
- 56 Puddingstone Ln
- 23 Cedar Farms Rd
- 20 Hawthorne Village Unit A
- 19 Sahlin Cir
- 10 Franklin St
- 1391 Pond St
Your Personal Tour Guide
Ask me questions while you tour the home.