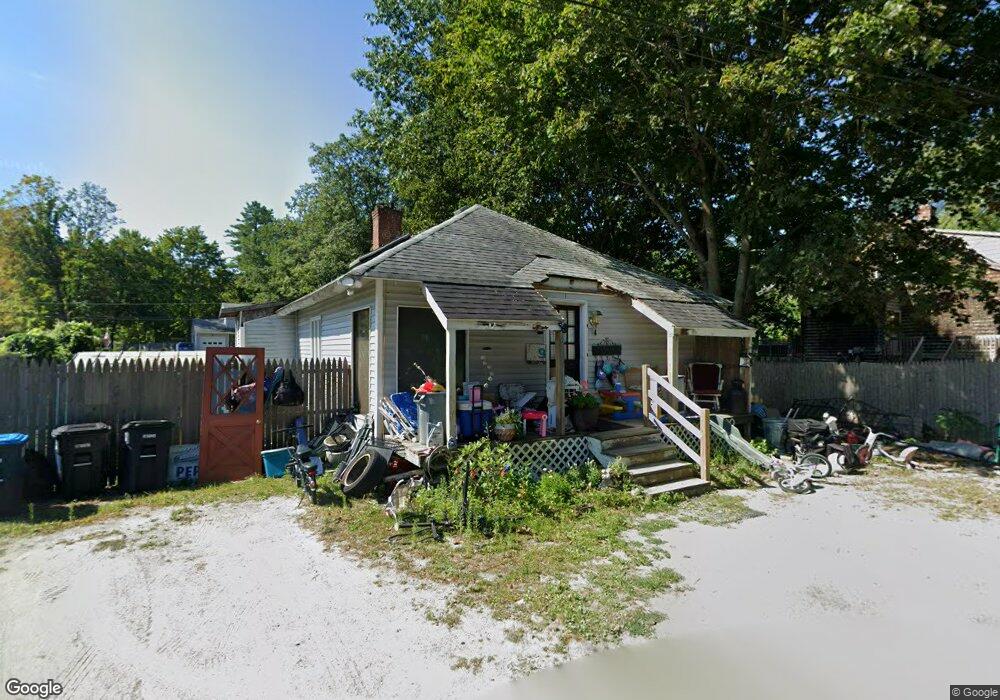
9 Honwee Rd Pittsfield, MA 01201
Estimated Value: $183,000 - $221,000
2
Beds
1
Bath
759
Sq Ft
$262/Sq Ft
Est. Value
About This Home
This home is located at 9 Honwee Rd, Pittsfield, MA 01201 and is currently estimated at $198,547, approximately $261 per square foot. 9 Honwee Rd is a home located in Berkshire County with nearby schools including Robert T. Capeless Elementary School, John T. Reid Middle School, and Taconic High School.
Ownership History
Date
Name
Owned For
Owner Type
Purchase Details
Closed on
Nov 9, 2007
Sold by
Jones Carolyn M
Bought by
Pepes Prop Llc
Current Estimated Value
Home Financials for this Owner
Home Financials are based on the most recent Mortgage that was taken out on this home.
Original Mortgage
$74,400
Outstanding Balance
$46,863
Interest Rate
6.47%
Mortgage Type
Purchase Money Mortgage
Estimated Equity
$151,684
Purchase Details
Closed on
May 31, 2001
Sold by
Galok Joseph P and Galok Kimberly A
Bought by
Jones Carolyn M
Home Financials for this Owner
Home Financials are based on the most recent Mortgage that was taken out on this home.
Original Mortgage
$73,000
Interest Rate
7.09%
Mortgage Type
Purchase Money Mortgage
Purchase Details
Closed on
Apr 18, 1989
Sold by
Salatino Catherine
Bought by
Galok Joseph
Create a Home Valuation Report for This Property
The Home Valuation Report is an in-depth analysis detailing your home's value as well as a comparison with similar homes in the area
Home Values in the Area
Average Home Value in this Area
Purchase History
| Date | Buyer | Sale Price | Title Company |
|---|---|---|---|
| Pepes Prop Llc | $93,000 | -- | |
| Pepes Prop Llc | $93,000 | -- | |
| Pepes Prop Llc | $93,000 | -- | |
| Jones Carolyn M | $73,000 | -- | |
| Jones Carolyn M | $73,000 | -- | |
| Galok Joseph | $69,500 | -- | |
| Galok Joseph | $69,500 | -- |
Source: Public Records
Mortgage History
| Date | Status | Borrower | Loan Amount |
|---|---|---|---|
| Open | Pepes Prop Llc | $74,400 | |
| Closed | Pepes Prop Llc | $74,400 | |
| Previous Owner | Galok Joseph | $73,000 |
Source: Public Records
Tax History
| Year | Tax Paid | Tax Assessment Tax Assessment Total Assessment is a certain percentage of the fair market value that is determined by local assessors to be the total taxable value of land and additions on the property. | Land | Improvement |
|---|---|---|---|---|
| 2025 | $2,436 | $135,800 | $60,700 | $75,100 |
| 2024 | $2,299 | $124,600 | $60,700 | $63,900 |
| 2023 | $2,114 | $115,400 | $56,100 | $59,300 |
| 2022 | $1,954 | $105,300 | $53,700 | $51,600 |
| 2021 | $1,833 | $95,200 | $53,700 | $41,500 |
| 2020 | $1,867 | $94,700 | $53,700 | $41,000 |
| 2019 | $1,713 | $88,200 | $48,600 | $39,600 |
| 2018 | $1,737 | $86,800 | $48,600 | $38,200 |
| 2017 | $1,655 | $84,300 | $46,700 | $37,600 |
| 2016 | $1,578 | $84,100 | $46,700 | $37,400 |
| 2015 | $1,519 | $84,100 | $46,700 | $37,400 |
Source: Public Records
Map
Nearby Homes
- 15 Orlando Ave
- 36 Beacon Ave
- 55 Newton Ave
- 30 Pinehurst Ave
- 140 Hancock Rd
- 0 Oakhurst Ave
- 119 Orlando Ave
- 1450 North St Unit 107
- 144 Brombach St
- 17 Fieldstone Dr
- 14 Sunrise Cir
- 15 Cherry Hill Dr
- 5 Aspen Way
- 11 Opeechee St
- 16 Opeechee St
- 33 Walden Ln
- 14 Highland Ave
- 0 Wabasso St
- 561 Pecks Rd
- 8 Iroquois St
Your Personal Tour Guide
Ask me questions while you tour the home.