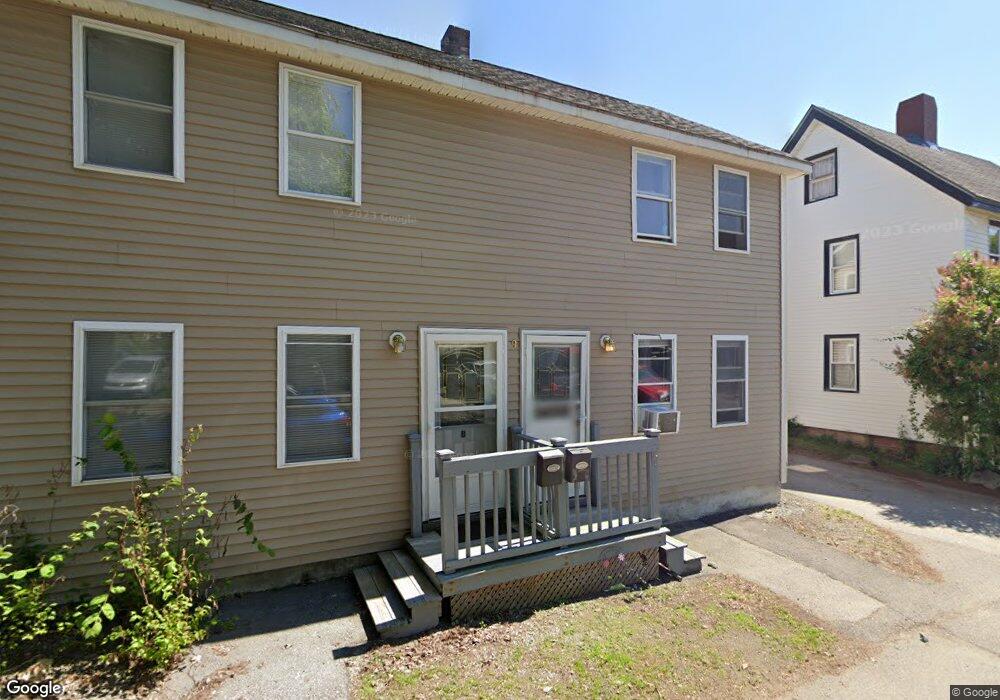
9 Howard St Brewer, ME 04412
Estimated Value: $290,000 - $401,000
6
Beds
3
Baths
2,184
Sq Ft
$157/Sq Ft
Est. Value
About This Home
This home is located at 9 Howard St, Brewer, ME 04412 and is currently estimated at $341,972, approximately $156 per square foot. 9 Howard St is a home located in Penobscot County with nearby schools including Brewer Community School, Brewer High School, and All Saints Catholic School St. Mary's campus PreK-3.
Ownership History
Date
Name
Owned For
Owner Type
Purchase Details
Closed on
Jul 15, 2021
Sold by
Thomley Jasson D
Bought by
Roxas Rodrigo and Roxas Sharon K
Current Estimated Value
Home Financials for this Owner
Home Financials are based on the most recent Mortgage that was taken out on this home.
Original Mortgage
$168,453
Outstanding Balance
$151,178
Interest Rate
2.9%
Mortgage Type
Purchase Money Mortgage
Estimated Equity
$190,794
Purchase Details
Closed on
Jun 6, 2005
Sold by
Bright Bridge Ltd
Bought by
Thomley Jasson D
Home Financials for this Owner
Home Financials are based on the most recent Mortgage that was taken out on this home.
Original Mortgage
$170,000
Interest Rate
5.83%
Mortgage Type
Purchase Money Mortgage
Create a Home Valuation Report for This Property
The Home Valuation Report is an in-depth analysis detailing your home's value as well as a comparison with similar homes in the area
Home Values in the Area
Average Home Value in this Area
Purchase History
| Date | Buyer | Sale Price | Title Company |
|---|---|---|---|
| Roxas Rodrigo | -- | None Available | |
| Roxas Rodrigo | -- | None Available | |
| Roxas Rodrigo | -- | None Available | |
| Roxas Rodrigo | -- | None Available | |
| Thomley Jasson D | -- | -- | |
| Thomley Jasson D | -- | -- | |
| Thomley Jasson D | -- | -- | |
| Thomley Jasson D | -- | -- | |
| Thomley Jasson D | -- | -- | |
| Thomley Jasson D | -- | -- |
Source: Public Records
Mortgage History
| Date | Status | Borrower | Loan Amount |
|---|---|---|---|
| Open | Roxas Rodrigo | $168,453 | |
| Closed | Roxas Rodrigo | $168,453 | |
| Previous Owner | Thomley Jasson D | $170,000 |
Source: Public Records
Tax History
| Year | Tax Paid | Tax Assessment Tax Assessment Total Assessment is a certain percentage of the fair market value that is determined by local assessors to be the total taxable value of land and additions on the property. | Land | Improvement |
|---|---|---|---|---|
| 2025 | $5,465 | $354,900 | $25,500 | $329,400 |
| 2024 | $5,381 | $286,200 | $25,500 | $260,700 |
| 2023 | $5,200 | $258,700 | $23,600 | $235,100 |
| 2021 | $4,944 | $221,700 | $23,400 | $198,300 |
| 2020 | $3,981 | $175,000 | $23,400 | $151,600 |
| 2019 | $3,973 | $172,800 | $23,400 | $149,400 |
| 2018 | $3,803 | $172,800 | $23,400 | $149,400 |
| 2017 | $3,888 | $172,800 | $23,400 | $149,400 |
| 2016 | $3,719 | $172,800 | $23,400 | $149,400 |
| 2015 | $3,719 | $172,800 | $23,400 | $149,400 |
| 2014 | $3,615 | $172,800 | $23,400 | $149,400 |
| 2013 | $4,067 | $194,400 | $11,600 | $182,800 |
Source: Public Records
Map
Nearby Homes
Your Personal Tour Guide
Ask me questions while you tour the home.