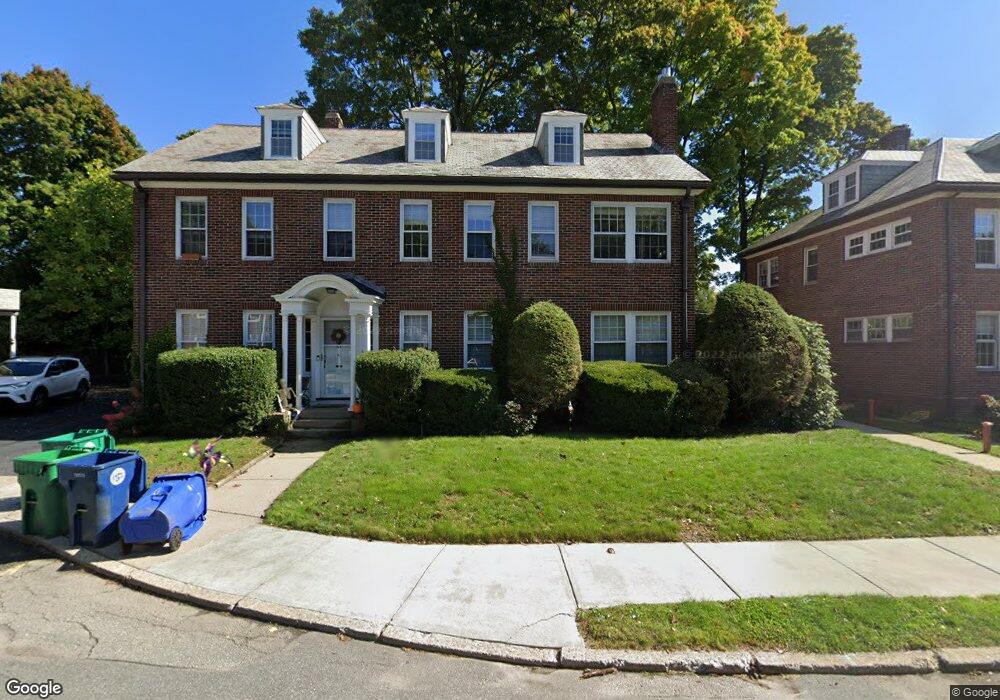
9 Hunnewell Cir Unit 11 Newton, MA 02458
Newton Corner NeighborhoodEstimated Value: $1,651,000 - $1,856,000
2
Beds
1
Bath
1,700
Sq Ft
$1,052/Sq Ft
Est. Value
About This Home
This home is located at 9 Hunnewell Cir Unit 11, Newton, MA 02458 and is currently estimated at $1,788,430, approximately $1,052 per square foot. 9 Hunnewell Cir Unit 11 is a home located in Middlesex County with nearby schools including Underwood Elementary School, Bigelow Middle School, and Newton North High School.
Ownership History
Date
Name
Owned For
Owner Type
Purchase Details
Closed on
Feb 6, 2018
Sold by
Barton Daniel C and Barton Kathryn J
Bought by
Hibernia Rt
Current Estimated Value
Purchase Details
Closed on
Jul 20, 2017
Sold by
Sumner Scott B and Xu Bi
Bought by
Barton Daniel C and Irwin Ann
Home Financials for this Owner
Home Financials are based on the most recent Mortgage that was taken out on this home.
Original Mortgage
$900,000
Interest Rate
3.89%
Mortgage Type
Unknown
Purchase Details
Closed on
Mar 19, 1997
Sold by
Baldwin Ronald W and Baldwin Diane B
Bought by
Sumner Scott B and Xu Bi
Home Financials for this Owner
Home Financials are based on the most recent Mortgage that was taken out on this home.
Original Mortgage
$274,550
Interest Rate
7.68%
Mortgage Type
Purchase Money Mortgage
Purchase Details
Closed on
Aug 22, 1991
Sold by
Piscopo David G and Piscopos Karen B
Bought by
Sumner Scott B and Sumner Ronald
Home Financials for this Owner
Home Financials are based on the most recent Mortgage that was taken out on this home.
Original Mortgage
$258,750
Interest Rate
9.55%
Mortgage Type
Purchase Money Mortgage
Create a Home Valuation Report for This Property
The Home Valuation Report is an in-depth analysis detailing your home's value as well as a comparison with similar homes in the area
Home Values in the Area
Average Home Value in this Area
Purchase History
| Date | Buyer | Sale Price | Title Company |
|---|---|---|---|
| Hibernia Rt | -- | -- | |
| Barton Daniel C | $1,350,000 | -- | |
| Sumner Scott B | $60,700 | -- | |
| Sumner Scott B | $345,000 | -- |
Source: Public Records
Mortgage History
| Date | Status | Borrower | Loan Amount |
|---|---|---|---|
| Previous Owner | Barton Daniel C | $900,000 | |
| Previous Owner | Sumner Scott B | $290,650 | |
| Previous Owner | Sumner Scott B | $274,550 | |
| Previous Owner | Sumner Scott B | $258,750 |
Source: Public Records
Tax History Compared to Growth
Tax History
| Year | Tax Paid | Tax Assessment Tax Assessment Total Assessment is a certain percentage of the fair market value that is determined by local assessors to be the total taxable value of land and additions on the property. | Land | Improvement |
|---|---|---|---|---|
| 2025 | $15,383 | $1,569,700 | $852,800 | $716,900 |
| 2024 | $14,874 | $1,524,000 | $828,000 | $696,000 |
| 2023 | $14,554 | $1,429,700 | $663,400 | $766,300 |
| 2022 | $13,926 | $1,323,800 | $614,300 | $709,500 |
| 2021 | $13,068 | $1,214,500 | $563,600 | $650,900 |
| 2020 | $12,679 | $1,214,500 | $563,600 | $650,900 |
| 2019 | $11,861 | $1,135,000 | $526,700 | $608,300 |
| 2018 | $11,980 | $1,107,200 | $496,400 | $610,800 |
| 2017 | $9,801 | $881,400 | $455,400 | $426,000 |
| 2016 | $9,202 | $808,600 | $417,800 | $390,800 |
| 2015 | $8,774 | $755,700 | $390,500 | $365,200 |
Source: Public Records
Map
Nearby Homes
- 180 Hunnewell Ave Unit 180
- 159 Washington St Unit 4
- 65-67 Saint James Cir
- 70 Washington St Unit 70
- 70 Washington St
- 4 Remick Terrace
- 4 Remick Terrace Unit 4
- 68 Vernon St
- 9 Baldwin St Unit 15C
- 10 Williams St Unit 39
- 10 Williams St Unit 56
- 164 Galen St Unit 88
- 164 Galen St Unit 65
- 121 Tremont St Unit B1
- 12 Richardson St Unit 14
- 69 Presentation Rd
- 34 Channing St Unit 1
- 34 Channing St Unit 2
- 99 Tremont St Unit 105
- 99 Tremont St Unit 413
- 9 Hunnewell Cir Unit 9
- 9/11 Hunnewell Cir
- 3 Hunnewell Cir Unit 1
- 3 Hunnewell Cir
- 119 Washington St
- 119 Washington St Unit 2
- 111 Washington St Unit 113
- 111 Washington St Unit 4
- 111 Washington St
- 111 Washington St Unit 127 washington
- 111 Washington St Unit 111
- 111 Washington St Unit 7
- 111 Washington St Unit 1,11
- 113 Washington St Unit 63
- 17 Hunnewell Cir Unit 1
- 17 Hunnewell Cir
- 15 Hunnewell Cir Unit 17
- 10 Hunnewell Cir Unit 12
- 129 Washington St Unit 2
- 129 Washington St Unit 1