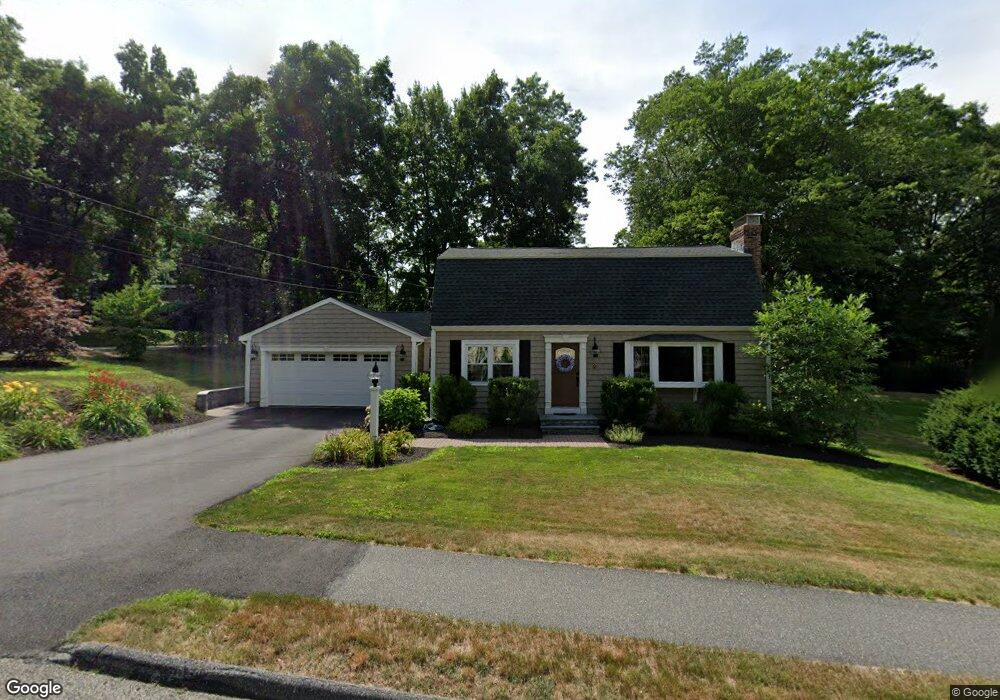
9 Hyder St Westborough, MA 01581
Estimated Value: $724,922 - $788,000
4
Beds
2
Baths
1,868
Sq Ft
$411/Sq Ft
Est. Value
About This Home
This home is located at 9 Hyder St, Westborough, MA 01581 and is currently estimated at $767,231, approximately $410 per square foot. 9 Hyder St is a home located in Worcester County with nearby schools including Westborough High School, Al-Hamra Academy, and Ebridge Montessori School.
Ownership History
Date
Name
Owned For
Owner Type
Purchase Details
Closed on
Sep 27, 2002
Sold by
Seatter Connie M
Bought by
West Kenneth C and Connole-West Bridget E
Current Estimated Value
Purchase Details
Closed on
Jul 10, 2002
Sold by
Graham Christopher A and Graham Michelle S
Bought by
Seatter Connie M
Purchase Details
Closed on
Mar 15, 1999
Sold by
Bliss William R and Bliss Vivian R
Bought by
Graham Christopher A and Graham Michelle S
Purchase Details
Closed on
Apr 20, 1988
Sold by
Dodd Alan F
Bought by
Bliss W R
Create a Home Valuation Report for This Property
The Home Valuation Report is an in-depth analysis detailing your home's value as well as a comparison with similar homes in the area
Home Values in the Area
Average Home Value in this Area
Purchase History
| Date | Buyer | Sale Price | Title Company |
|---|---|---|---|
| West Kenneth C | $392,600 | -- | |
| Seatter Connie M | $377,500 | -- | |
| Graham Christopher A | $215,000 | -- | |
| Bliss W R | $203,000 | -- |
Source: Public Records
Mortgage History
| Date | Status | Borrower | Loan Amount |
|---|---|---|---|
| Open | Bliss W R | $268,000 | |
| Closed | Bliss W R | $292,500 |
Source: Public Records
Tax History Compared to Growth
Tax History
| Year | Tax Paid | Tax Assessment Tax Assessment Total Assessment is a certain percentage of the fair market value that is determined by local assessors to be the total taxable value of land and additions on the property. | Land | Improvement |
|---|---|---|---|---|
| 2025 | $9,961 | $611,500 | $326,700 | $284,800 |
| 2024 | $9,510 | $579,500 | $310,900 | $268,600 |
| 2023 | $9,053 | $537,600 | $293,200 | $244,400 |
| 2022 | $8,509 | $460,200 | $244,000 | $216,200 |
| 2021 | $7,766 | $418,900 | $202,700 | $216,200 |
| 2020 | $7,546 | $411,900 | $200,700 | $211,200 |
| 2019 | $7,477 | $407,900 | $210,600 | $197,300 |
| 2018 | $7,013 | $379,900 | $200,700 | $179,200 |
| 2017 | $6,762 | $379,900 | $200,700 | $179,200 |
| 2016 | $6,653 | $374,400 | $196,800 | $177,600 |
| 2015 | $6,549 | $352,300 | $185,000 | $167,300 |
Source: Public Records
Map
Nearby Homes