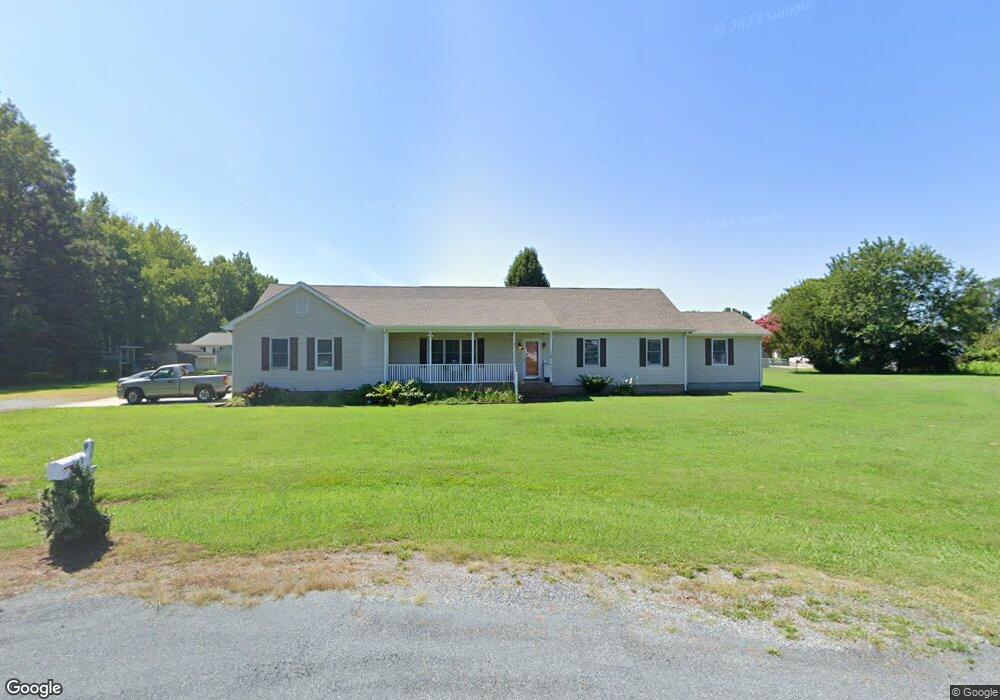
9 James St Onancock, VA 23417
Estimated Value: $327,711 - $427,000
4
Beds
2
Baths
2,271
Sq Ft
$169/Sq Ft
Est. Value
About This Home
This home is located at 9 James St, Onancock, VA 23417 and is currently estimated at $384,178, approximately $169 per square foot. 9 James St is a home located in Accomack County with nearby schools including Accawmacke Elementary School, Nandua Middle School, and Nandua High School.
Ownership History
Date
Name
Owned For
Owner Type
Purchase Details
Closed on
Mar 28, 2016
Sold by
Hud & Housing Of Urban Dev
Bought by
Parker Fabian I and Parker Lucila B
Current Estimated Value
Home Financials for this Owner
Home Financials are based on the most recent Mortgage that was taken out on this home.
Original Mortgage
$142,504
Outstanding Balance
$112,987
Interest Rate
3.62%
Mortgage Type
FHA
Estimated Equity
$271,191
Create a Home Valuation Report for This Property
The Home Valuation Report is an in-depth analysis detailing your home's value as well as a comparison with similar homes in the area
Home Values in the Area
Average Home Value in this Area
Purchase History
| Date | Buyer | Sale Price | Title Company |
|---|---|---|---|
| Parker Fabian I | $130,007 | Stewart Title Guaranty Co |
Source: Public Records
Mortgage History
| Date | Status | Borrower | Loan Amount |
|---|---|---|---|
| Open | Parker Fabian I | $142,504 |
Source: Public Records
Tax History
| Year | Tax Paid | Tax Assessment Tax Assessment Total Assessment is a certain percentage of the fair market value that is determined by local assessors to be the total taxable value of land and additions on the property. | Land | Improvement |
|---|---|---|---|---|
| 2025 | $1,425 | $266,900 | $31,500 | $235,400 |
| 2024 | $1,292 | $266,900 | $31,500 | $235,400 |
| 2023 | $1,216 | $204,300 | $31,500 | $172,800 |
| 2022 | $1,216 | $204,300 | $31,500 | $172,800 |
| 2021 | $1,192 | $195,400 | $31,500 | $163,900 |
| 2020 | $1,192 | $195,400 | $31,500 | $163,900 |
| 2019 | $1,116 | $183,000 | $31,500 | $151,500 |
| 2018 | $1,116 | $183,000 | $31,500 | $151,500 |
| 2017 | $1,139 | $186,700 | $31,500 | $155,200 |
| 2016 | $1,139 | $186,700 | $31,500 | $155,200 |
| 2015 | $111 | $190,600 | $31,500 | $159,100 |
| 2014 | $1,106 | $190,600 | $31,500 | $159,100 |
| 2013 | -- | $197,000 | $31,500 | $165,500 |
Source: Public Records
Map
Nearby Homes
Your Personal Tour Guide
Ask me questions while you tour the home.