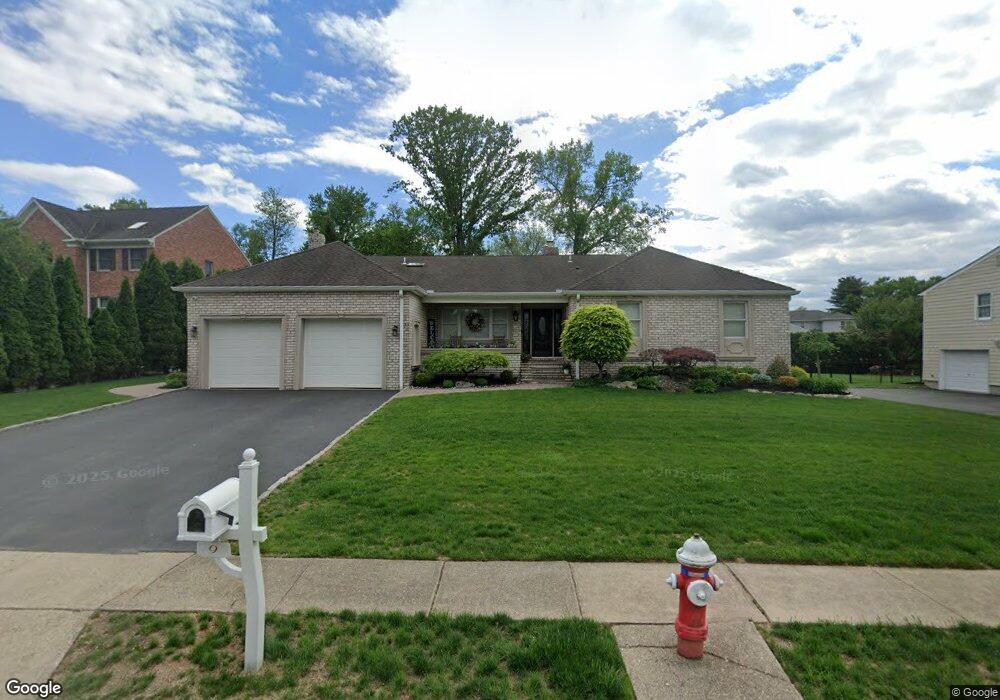
9 John St Fairfield, NJ 07004
Estimated Value: $159,000 - $1,032,000
Studio
--
Bath
2,895
Sq Ft
$212/Sq Ft
Est. Value
About This Home
This home is located at 9 John St, Fairfield, NJ 07004 and is currently estimated at $612,314, approximately $211 per square foot. 9 John St is a home located in Essex County with nearby schools including Adlai E Stevenson School, Churchill, and West Essex Middle School.
Ownership History
Date
Name
Owned For
Owner Type
Purchase Details
Closed on
Sep 21, 2005
Sold by
Peevers William
Bought by
Lombardo Joseph and Lombardo Debra
Current Estimated Value
Home Financials for this Owner
Home Financials are based on the most recent Mortgage that was taken out on this home.
Original Mortgage
$175,000
Outstanding Balance
$93,213
Interest Rate
5.78%
Estimated Equity
$519,101
Purchase Details
Closed on
Jan 28, 1999
Sold by
Schubert Linda
Bought by
Peevers William and Peevers Joanne
Home Financials for this Owner
Home Financials are based on the most recent Mortgage that was taken out on this home.
Original Mortgage
$275,000
Interest Rate
6.75%
Purchase Details
Closed on
Feb 26, 1991
Sold by
Schubert Roger and Schubert Linda J
Bought by
Schubert Linda J
Create a Home Valuation Report for This Property
The Home Valuation Report is an in-depth analysis detailing your home's value as well as a comparison with similar homes in the area
Home Values in the Area
Average Home Value in this Area
Purchase History
| Date | Buyer | Sale Price | Title Company |
|---|---|---|---|
| Lombardo Joseph | $745,000 | -- | |
| Peevers William | $307,500 | -- | |
| Schubert Linda J | -- | -- |
Source: Public Records
Mortgage History
| Date | Status | Borrower | Loan Amount |
|---|---|---|---|
| Open | Lombardo Joseph | $175,000 | |
| Previous Owner | Peevers William | $275,000 |
Source: Public Records
Tax History
| Year | Tax Paid | Tax Assessment Tax Assessment Total Assessment is a certain percentage of the fair market value that is determined by local assessors to be the total taxable value of land and additions on the property. | Land | Improvement |
|---|---|---|---|---|
| 2025 | $15,777 | $738,600 | $289,900 | $448,700 |
Source: Public Records
Map
Nearby Homes
- 5 Addison Dr
- 20 West Dr
- 19 West Dr
- 2 Caryn Place
- 74 Camp Ln
- 584-588 U S 46
- 78 Lane Rd Unit 1
- 131 Horseneck Rd
- 96 Pier Ln
- 33 Riveredge Dr
- 140 W Greenbrook Rd
- 8 Winfield Ct
- 82 Stonyridge Dr Unit 82
- 71 Schindler Way
- 29 Long Acres Rd
- 73 Big Piece Rd
- 21 Styles Terrace
- 53 Alpine Dr Unit Y156
- 30 Andrea Dr
- 11 Cypress Ave
Your Personal Tour Guide
Ask me questions while you tour the home.