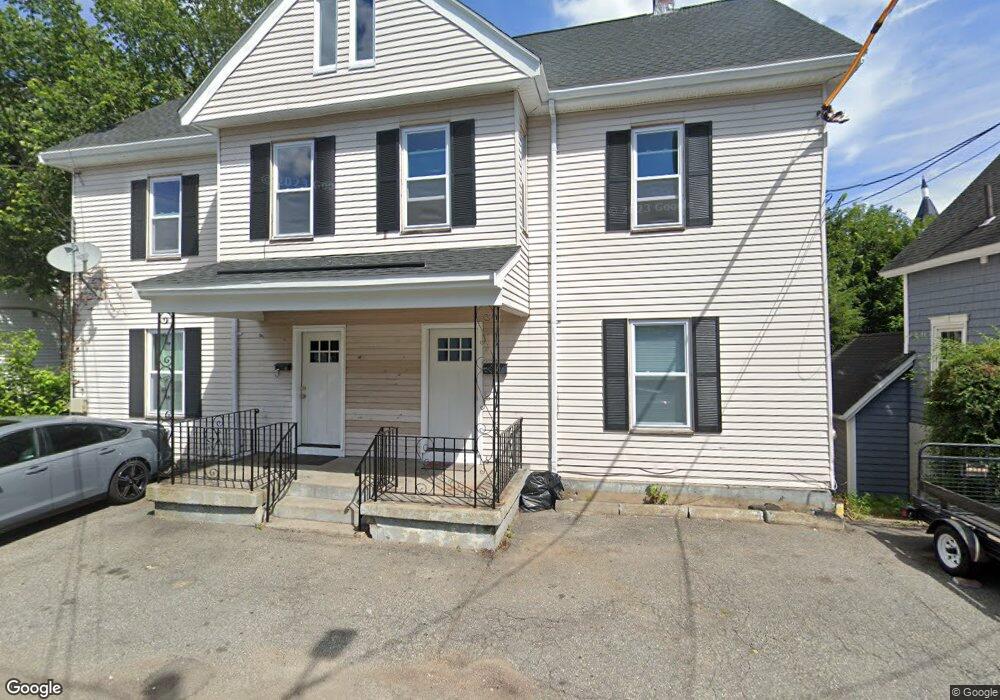
9 Johnson St Woburn, MA 01801
Downtown Woburn NeighborhoodEstimated Value: $747,000 - $822,000
9
Beds
4
Baths
2,680
Sq Ft
$289/Sq Ft
Est. Value
About This Home
This home is located at 9 Johnson St, Woburn, MA 01801 and is currently estimated at $773,664, approximately $288 per square foot. 9 Johnson St is a home located in Middlesex County with nearby schools including Malcolm White Elementary School, John F. Kennedy Middle School, and Woburn High School.
Ownership History
Date
Name
Owned For
Owner Type
Purchase Details
Closed on
Jun 2, 2023
Sold by
Keng Yuetung J
Bought by
Nguyen Vi and Phan Tu
Current Estimated Value
Home Financials for this Owner
Home Financials are based on the most recent Mortgage that was taken out on this home.
Original Mortgage
$472,500
Outstanding Balance
$458,855
Interest Rate
6.39%
Mortgage Type
Purchase Money Mortgage
Estimated Equity
$314,809
Purchase Details
Closed on
Sep 29, 2008
Sold by
Yang Lijuan
Bought by
Keng Yuetung J
Home Financials for this Owner
Home Financials are based on the most recent Mortgage that was taken out on this home.
Original Mortgage
$336,000
Interest Rate
6.57%
Mortgage Type
Purchase Money Mortgage
Purchase Details
Closed on
Mar 8, 2005
Sold by
Gately Brenda L and Gately Daniel J
Bought by
Yang Lijuan
Home Financials for this Owner
Home Financials are based on the most recent Mortgage that was taken out on this home.
Original Mortgage
$245,000
Interest Rate
5.66%
Mortgage Type
Purchase Money Mortgage
Create a Home Valuation Report for This Property
The Home Valuation Report is an in-depth analysis detailing your home's value as well as a comparison with similar homes in the area
Home Values in the Area
Average Home Value in this Area
Purchase History
| Date | Buyer | Sale Price | Title Company |
|---|---|---|---|
| Nguyen Vi | $630,000 | None Available | |
| Keng Yuetung J | $380,000 | -- | |
| Keng Yuetung J | $380,000 | -- | |
| Keng Yuetung J | $380,000 | -- | |
| Yang Lijuan | $350,000 | -- | |
| Yang Lijuan | $350,000 | -- | |
| Yang Lijuan | $350,000 | -- |
Source: Public Records
Mortgage History
| Date | Status | Borrower | Loan Amount |
|---|---|---|---|
| Open | Nguyen Vi | $472,500 | |
| Previous Owner | Keng Yuetung J | $336,000 | |
| Previous Owner | Yang Lijuan | $245,000 |
Source: Public Records
Tax History Compared to Growth
Tax History
| Year | Tax Paid | Tax Assessment Tax Assessment Total Assessment is a certain percentage of the fair market value that is determined by local assessors to be the total taxable value of land and additions on the property. | Land | Improvement |
|---|---|---|---|---|
| 2025 | $5,265 | $616,500 | $236,200 | $380,300 |
| 2024 | $5,546 | $688,100 | $224,900 | $463,200 |
| 2023 | $5,639 | $648,200 | $204,500 | $443,700 |
| 2022 | $5,577 | $597,100 | $177,800 | $419,300 |
| 2021 | $5,492 | $588,600 | $169,300 | $419,300 |
| 2020 | $4,917 | $527,600 | $169,300 | $358,300 |
| 2019 | $4,611 | $485,400 | $161,200 | $324,200 |
| 2018 | $4,561 | $461,200 | $147,900 | $313,300 |
| 2017 | $3,908 | $393,200 | $140,900 | $252,300 |
| 2016 | $3,688 | $367,000 | $131,700 | $235,300 |
| 2015 | $3,645 | $358,400 | $123,100 | $235,300 |
| 2014 | $3,665 | $351,100 | $123,100 | $228,000 |
Source: Public Records
Map
Nearby Homes
- 11 Hovey St
- 21 Franklin St
- 477 Main St
- 14 Church Ave
- 14 Church Ave Unit 2
- 18 Church St Unit 2
- 9 Wade Ave
- 34 Union St
- 26 Flagg St
- 37 1/2 Chestnut St
- 602 Main St Unit 1
- 7 Prospect St
- 12 Mishawum Rd
- 462 Place Ln
- 166 Place Ln Unit 166
- 168 Place Ln
- 52 Pleasant St
- 2 Eastern Ave
- 35 Prospect St Unit 215
- 35 Prospect St Unit 204
- 9 Johnson St Unit 9
- 11 Johnson St
- 2 Plympton St
- 7 Johnson St
- 4 Plympton St
- 546 Main St
- 544 Main St Unit 2
- 544 Main St Unit 1
- 544 Main St
- 6 Johnson St
- 1 Johnson St
- 538 Main St
- 536 Main St
- 536 Main St Unit E
- 536 Main St Unit C
- 536 Main St Unit D
- 536 Main St Unit F
- 536 Main St Unit A
- 13 Franklin St Unit 1
- 2 Johnson St