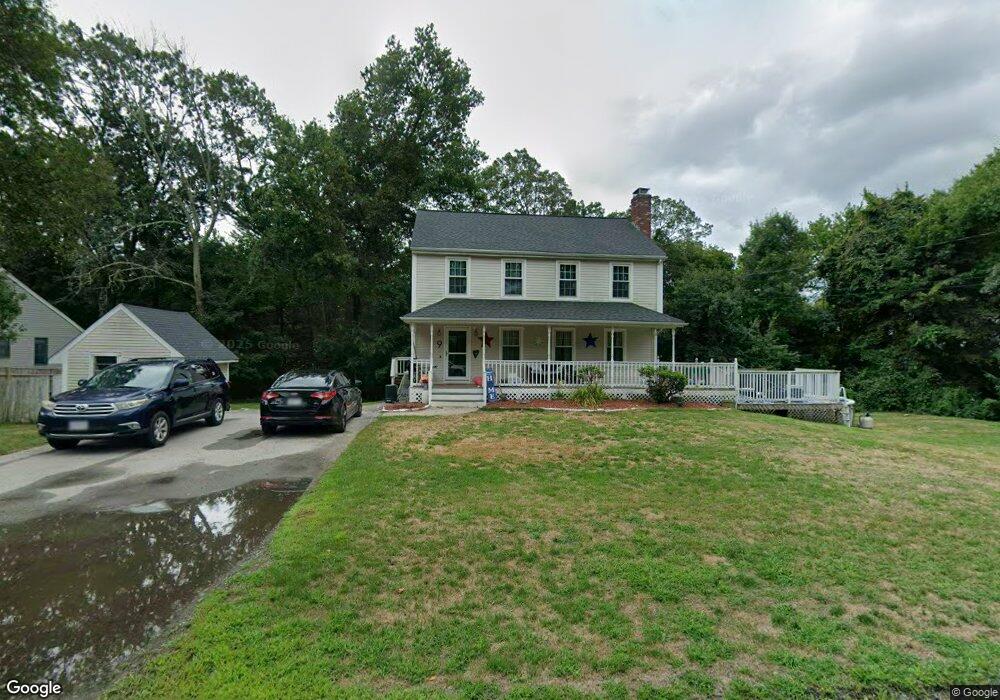
9 Judge St North Attleboro, MA 02760
North Attleboro NeighborhoodEstimated Value: $510,000 - $641,000
3
Beds
2
Baths
1,664
Sq Ft
$346/Sq Ft
Est. Value
About This Home
This home is located at 9 Judge St, North Attleboro, MA 02760 and is currently estimated at $574,990, approximately $345 per square foot. 9 Judge St is a home located in Bristol County with nearby schools including North Attleboro High School.
Ownership History
Date
Name
Owned For
Owner Type
Purchase Details
Closed on
Mar 15, 2025
Sold by
Wescott Eric E
Bought by
Wescott Carol A
Current Estimated Value
Purchase Details
Closed on
Aug 18, 2010
Sold by
Mill Pond Rt and Leroy
Bought by
Rogers Michael L and Rogers Rebecca S
Purchase Details
Closed on
Jul 2, 2003
Sold by
Mcsweeney Patrick J and Mcsweeney Paula J
Bought by
Wescott Eric E and Wescott Carol Ann
Purchase Details
Closed on
Mar 27, 1998
Sold by
Henry Raymond E and Henry Gail M
Bought by
Case Steven A and Landry David R
Create a Home Valuation Report for This Property
The Home Valuation Report is an in-depth analysis detailing your home's value as well as a comparison with similar homes in the area
Home Values in the Area
Average Home Value in this Area
Purchase History
| Date | Buyer | Sale Price | Title Company |
|---|---|---|---|
| Wescott Carol A | -- | None Available | |
| Rogers Michael L | -- | -- | |
| Rogers Michael L | -- | -- | |
| Wescott Eric E | $342,000 | -- | |
| Wescott Eric E | $342,000 | -- | |
| Case Steven A | $44,000 | -- |
Source: Public Records
Mortgage History
| Date | Status | Borrower | Loan Amount |
|---|---|---|---|
| Previous Owner | Case Steven A | $25,000 | |
| Previous Owner | Case Steven A | $211,045 |
Source: Public Records
Tax History Compared to Growth
Tax History
| Year | Tax Paid | Tax Assessment Tax Assessment Total Assessment is a certain percentage of the fair market value that is determined by local assessors to be the total taxable value of land and additions on the property. | Land | Improvement |
|---|---|---|---|---|
| 2025 | $5,719 | $485,100 | $138,300 | $346,800 |
| 2024 | $5,741 | $497,500 | $138,300 | $359,200 |
| 2023 | $5,455 | $426,500 | $138,300 | $288,200 |
| 2022 | $5,201 | $373,400 | $138,300 | $235,100 |
| 2021 | $4,996 | $350,100 | $138,300 | $211,800 |
| 2020 | $4,938 | $344,100 | $138,300 | $205,800 |
| 2019 | $4,722 | $331,600 | $125,800 | $205,800 |
| 2018 | $4,262 | $319,500 | $125,800 | $193,700 |
| 2017 | $4,224 | $319,500 | $125,800 | $193,700 |
| 2016 | $4,271 | $323,100 | $139,700 | $183,400 |
| 2015 | $4,104 | $312,300 | $139,700 | $172,600 |
| 2014 | $3,910 | $295,300 | $122,700 | $172,600 |
Source: Public Records
Map
Nearby Homes
- 151 Roosevelt Ave Unit A
- 12 Roosevelt Ave
- 60 Crescent Ave
- 99 Arnold Rd
- 16 Johnson St
- 93 Bank St
- 85 Richards Ave
- 80 Broadway Unit 9
- 160 Crescent Ave
- 33 Ash St
- 19 Metcalf Cir
- 16 Richards Ave Unit 106
- 19 Church St Unit A5
- 50 Metcalf Rd
- 20 Holbrook Ave
- 58 Jay St
- 40 Sperry Ln
- 30 Sperry Ln Unit Lot 15
- 334 S Washington St
- 300 E Washington St Unit 4M