
Seller's Agent in 2025
Nicole Palmerino
Keller Williams Boston MetroWest
(774) 249-2381
2 in this area
66 Total Sales
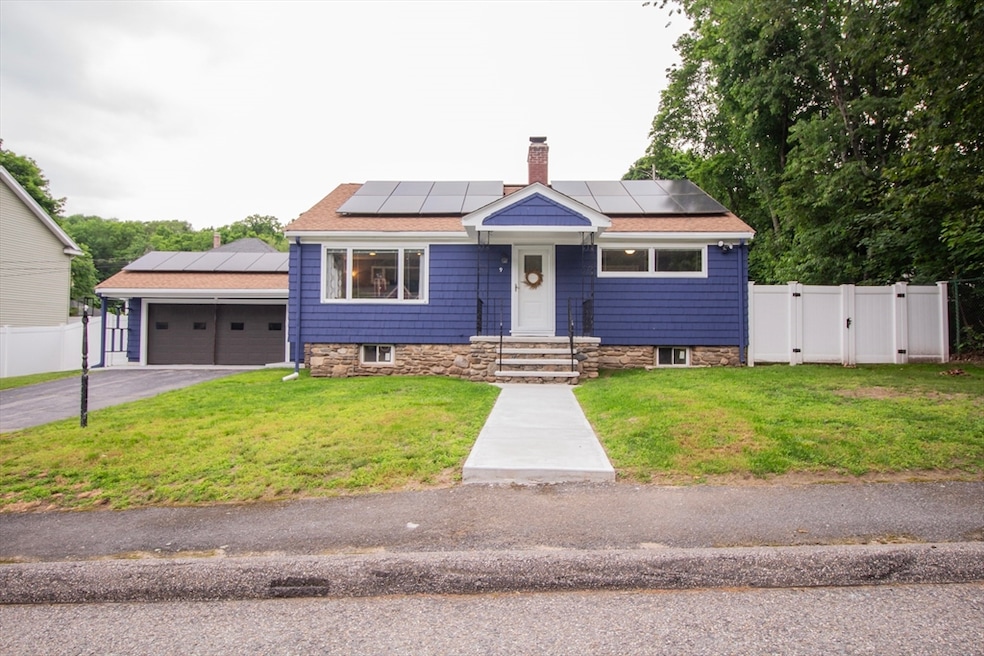
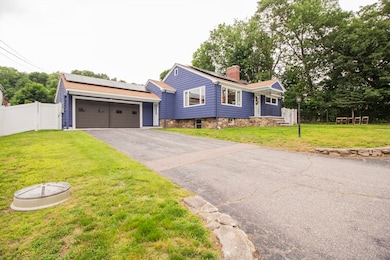
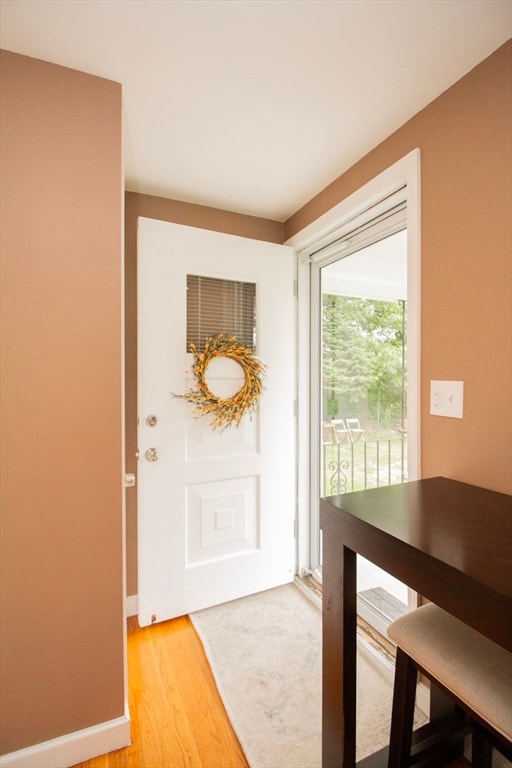
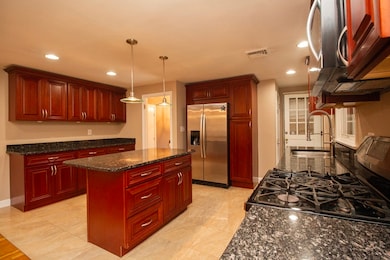
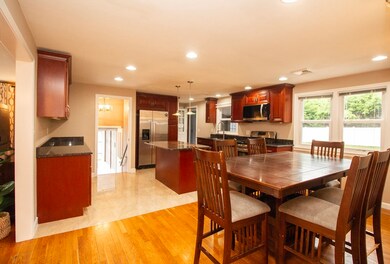
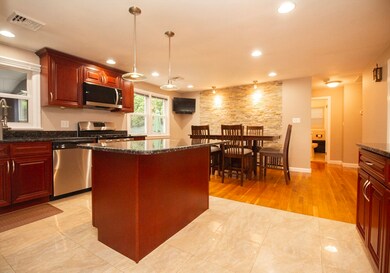
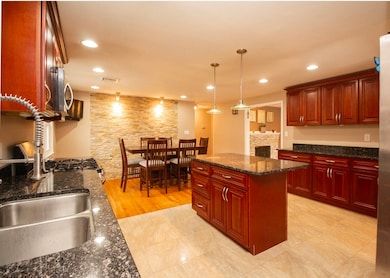
MULTIPLE OFFERS - all offers due Monday at 12:00pm-please make all offer good until Tuesday at 1. Welcome home to this move in ready 2 bedroom home with with an extra bonus bedroom in the basement!! This home features sparkling hardwood floors, a huge cabinet-packed kitchen with an island, along with stainless steel appliances, a YOUNG Roof, Freshly Painted exterior, CENTRAL AIR, Gas Heating and so much more. The young windows will keep your energy bills down, coupled with solar panels which will keep the electric bills down. The living room features a stunning stone fireplace along with an open living space, which is great for entertaining. You are just minutes from coes pond, and you have views of the pond from your living room window! This home also features a FULLY finished basement with a bonus bedroom and a kitchenette/living room space! The icing on the cake is that this home is situated nicely on a dead end street, affording lots of privacy including a fully fenced in yard!!
Last Agent to Sell the Property
Keller Williams Boston MetroWest Listed on: 06/18/2025
| Date | Type | Sale Price | Title Company |
|---|---|---|---|
| Quit Claim Deed | $495,000 | -- | |
| Deed | $495,000 | -- | |
| Fiduciary Deed | $135,000 | -- | |
| Fiduciary Deed | $135,000 | -- | |
| Fiduciary Deed | $135,000 | -- | |
| Quit Claim Deed | $167,000 | -- | |
| Quit Claim Deed | $167,000 | -- | |
| Quit Claim Deed | $167,000 | -- |
| Date | Status | Loan Amount | Loan Type |
|---|---|---|---|
| Open | $396,000 | New Conventional | |
| Closed | $396,000 | New Conventional | |
| Previous Owner | $108,000 | New Conventional |
| Date | Event | Price | List to Sale | Price per Sq Ft |
|---|---|---|---|---|
| 07/30/2025 07/30/25 | Sold | $495,000 | +3.1% | $261 / Sq Ft |
| 06/23/2025 06/23/25 | Pending | -- | -- | -- |
| 06/18/2025 06/18/25 | For Sale | $479,900 | -- | $253 / Sq Ft |
| Year | Tax Paid | Tax Assessment Tax Assessment Total Assessment is a certain percentage of the fair market value that is determined by local assessors to be the total taxable value of land and additions on the property. | Land | Improvement |
|---|---|---|---|---|
| 2025 | $4,428 | $335,700 | $98,700 | $237,000 |
| 2024 | $4,324 | $314,500 | $98,700 | $215,800 |
| 2023 | $4,189 | $292,100 | $85,800 | $206,300 |
| 2022 | $3,714 | $244,200 | $68,600 | $175,600 |
| 2021 | $3,608 | $221,600 | $54,900 | $166,700 |
| 2020 | $3,446 | $202,700 | $54,500 | $148,200 |
| 2019 | $3,211 | $178,400 | $47,700 | $130,700 |
| 2018 | $2,861 | $151,300 | $47,700 | $103,600 |
| 2017 | $2,908 | $151,300 | $47,700 | $103,600 |
| 2016 | $2,828 | $137,200 | $34,300 | $102,900 |
| 2015 | $2,754 | $137,200 | $34,300 | $102,900 |
| 2014 | $2,681 | $137,200 | $34,300 | $102,900 |
Seller's Agent in 2025
Nicole Palmerino
Keller Williams Boston MetroWest
(774) 249-2381
2 in this area
66 Total Sales
Buyer's Agent in 2025
Karen Russo
Coldwell Banker Realty - Worcester
(508) 614-8744
4 in this area
190 Total Sales
Source: MLS Property Information Network (MLS PIN)
MLS Number: 73393079
APN: WORC-000051-000010-000015
Disclaimer: Certain information contained herein is derived from information provided by parties other than Homes.com. All information provided is deemed reliable, but is not guaranteed to be accurate and should be independently verified.
![]() The property listing data and information, or the Images, set forth herein were provided to MLS Property Information Network, Inc. from third party sources, including sellers, lessors and public records, and were compiled by MLS Property Information Network, Inc. The property listing data and information, and the Images, are for the personal, non-commercial use of consumers having a good faith interest in purchasing or leasing listed properties of the type displayed to them and may not be used for any purpose other than to identify prospective properties which such consumers may have a good faith interest in purchasing or leasing. MLS Property Information Network, Inc. and its subscribers disclaim any and all representations and warranties as to the accuracy of the property listing data and information, or as to the accuracy of any of the Images, set forth herein.
The property listing data and information, or the Images, set forth herein were provided to MLS Property Information Network, Inc. from third party sources, including sellers, lessors and public records, and were compiled by MLS Property Information Network, Inc. The property listing data and information, and the Images, are for the personal, non-commercial use of consumers having a good faith interest in purchasing or leasing listed properties of the type displayed to them and may not be used for any purpose other than to identify prospective properties which such consumers may have a good faith interest in purchasing or leasing. MLS Property Information Network, Inc. and its subscribers disclaim any and all representations and warranties as to the accuracy of the property listing data and information, or as to the accuracy of any of the Images, set forth herein.
Ask me questions while you tour the home.