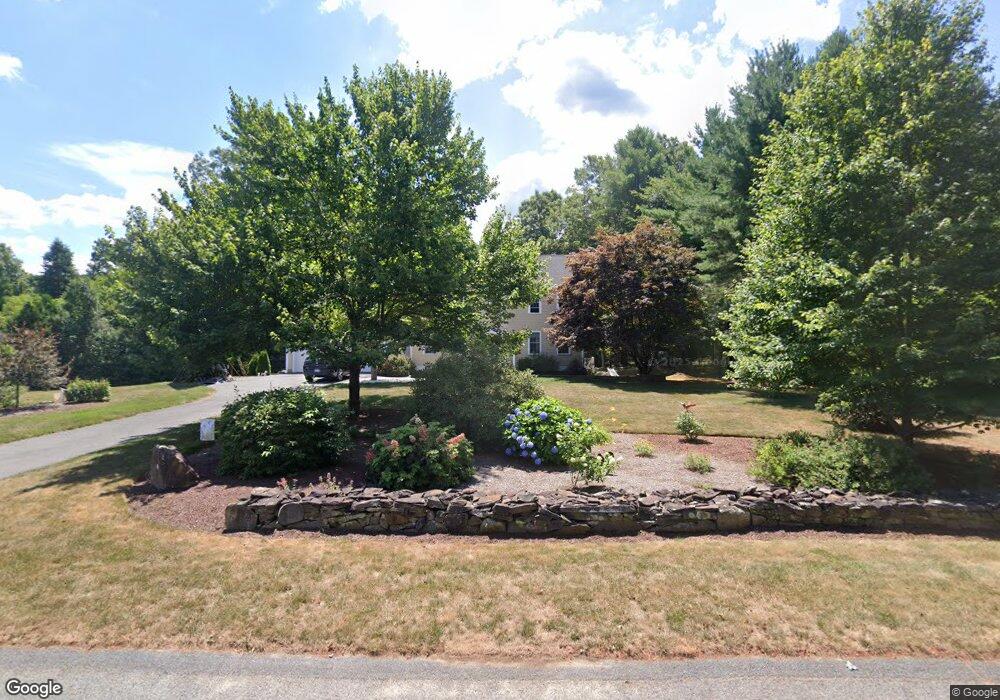
9 Katherine Rd Rehoboth, MA 02769
Estimated Value: $613,813 - $760,000
4
Beds
3
Baths
1,954
Sq Ft
$348/Sq Ft
Est. Value
About This Home
This home is located at 9 Katherine Rd, Rehoboth, MA 02769 and is currently estimated at $679,453, approximately $347 per square foot. 9 Katherine Rd is a home located in Bristol County with nearby schools including Dighton-Rehoboth Regional High School.
Ownership History
Date
Name
Owned For
Owner Type
Purchase Details
Closed on
Apr 22, 2022
Sold by
Dyer Alan R and Dyer Arline B
Bought by
Alan & Arline Dyer Irt and Dyer
Current Estimated Value
Purchase Details
Closed on
Jan 16, 2022
Sold by
Alan & Arline Dyer Irt and Dyer
Bought by
Dyer Alan R and Dyer Arline
Home Financials for this Owner
Home Financials are based on the most recent Mortgage that was taken out on this home.
Original Mortgage
$322,756
Interest Rate
3.22%
Mortgage Type
Stand Alone Refi Refinance Of Original Loan
Purchase Details
Closed on
Nov 7, 2019
Sold by
Dyer Alan R and Dyer Arline B
Bought by
Alan & Arline Dyer Irt
Create a Home Valuation Report for This Property
The Home Valuation Report is an in-depth analysis detailing your home's value as well as a comparison with similar homes in the area
Home Values in the Area
Average Home Value in this Area
Purchase History
| Date | Buyer | Sale Price | Title Company |
|---|---|---|---|
| Alan & Arline Dyer Irt | -- | None Available | |
| Dyer Alan R | -- | None Available | |
| Dyer Alan R | -- | None Available | |
| Alan & Arline Dyer Irt | -- | -- |
Source: Public Records
Mortgage History
| Date | Status | Borrower | Loan Amount |
|---|---|---|---|
| Previous Owner | Dyer Alan R | $322,756 |
Source: Public Records
Tax History Compared to Growth
Tax History
| Year | Tax Paid | Tax Assessment Tax Assessment Total Assessment is a certain percentage of the fair market value that is determined by local assessors to be the total taxable value of land and additions on the property. | Land | Improvement |
|---|---|---|---|---|
| 2025 | $60 | $539,300 | $190,700 | $348,600 |
| 2024 | $6,083 | $535,500 | $190,700 | $344,800 |
| 2023 | $5,665 | $489,200 | $186,700 | $302,500 |
| 2022 | $5,489 | $433,200 | $178,300 | $254,900 |
| 2021 | $5,075 | $395,800 | $162,000 | $233,800 |
| 2020 | $4,941 | $395,800 | $162,000 | $233,800 |
| 2018 | $4,766 | $369,300 | $154,200 | $215,100 |
| 2017 | $4,302 | $342,500 | $154,200 | $188,300 |
| 2016 | $4,161 | $342,500 | $154,200 | $188,300 |
| 2015 | $3,907 | $317,400 | $147,000 | $170,400 |
| 2014 | $3,859 | $310,200 | $139,800 | $170,400 |
Source: Public Records
Map
Nearby Homes
- 132 Fairview Ave
- Lot 11 Ledge Hill Ln
- Lot 11a Ledge Hill Ln
- 22 Bucklin Dr
- 101 Rocky Hill Rd
- 84 Fairview Ave
- 0 Sprague Rd Unit Rehoboth Massachuset
- 0 Sprague Rd Unit 73418184
- 257 Anawan St
- 1 Veader Farm Rd
- 43 Williams St
- 0 2 Rod Way
- 1080 Oakhill Ave
- 51 Saveena Dr
- 58 Saveena Dr
- 10 French Farm Rd
- 15 York Dr
- 2 Nicole Way
- 246 Winthrop St
- 225 Winthrop St
- 5 Katherine Rd
- 13 Katherine Rd
- 10 Katherine Rd
- 14 Katherine Rd
- 6 Katherine Rd
- 17 Katherine Rd
- 18 Katherine Rd
- 1 Katherine Rd
- 2 Katherine Rd
- 8 Victoria Ln
- 14 Victoria Ln
- 20 Victoria Ln
- 24 Victoria Ln
- 3 Victoria Ln
- 5 Victoria Ln
- 22 Katherine Rd
- 13 Victoria Ln
- 9 Victoria Ln
- 21 Victoria Ln
- 1 Victoria Ln