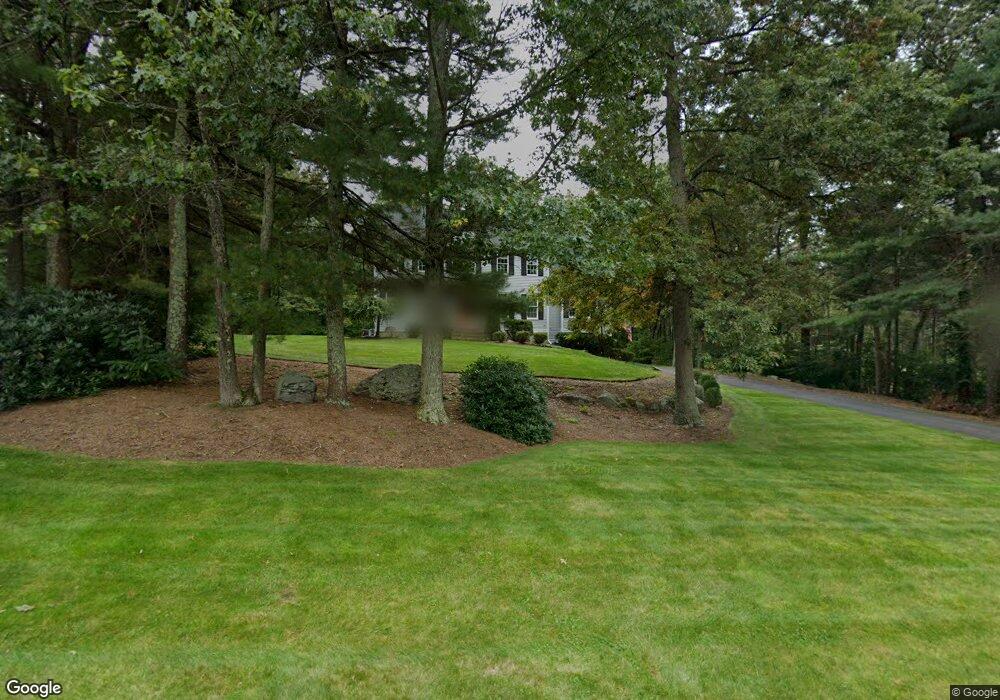
9 Kathryn Rd Foxboro, MA 02035
Estimated Value: $864,000 - $1,140,000
4
Beds
3
Baths
2,408
Sq Ft
$392/Sq Ft
Est. Value
About This Home
This home is located at 9 Kathryn Rd, Foxboro, MA 02035 and is currently estimated at $944,290, approximately $392 per square foot. 9 Kathryn Rd is a home located in Norfolk County with nearby schools including Foxborough High School, Foxborough Regional Charter School, and Hands-On-Montessori School.
Ownership History
Date
Name
Owned For
Owner Type
Purchase Details
Closed on
Oct 8, 1993
Sold by
Maystar Rlty Corp
Bought by
Oneil Michael S and Oneil Susan J
Current Estimated Value
Home Financials for this Owner
Home Financials are based on the most recent Mortgage that was taken out on this home.
Original Mortgage
$216,800
Interest Rate
6.9%
Mortgage Type
Purchase Money Mortgage
Purchase Details
Closed on
Apr 30, 1993
Sold by
Autumn Rt
Bought by
Maystar Corporation
Create a Home Valuation Report for This Property
The Home Valuation Report is an in-depth analysis detailing your home's value as well as a comparison with similar homes in the area
Home Values in the Area
Average Home Value in this Area
Purchase History
| Date | Buyer | Sale Price | Title Company |
|---|---|---|---|
| Oneil Michael S | $271,000 | -- | |
| Maystar Corporation | $99,000 | -- |
Source: Public Records
Mortgage History
| Date | Status | Borrower | Loan Amount |
|---|---|---|---|
| Closed | Maystar Corporation | $216,800 |
Source: Public Records
Tax History Compared to Growth
Tax History
| Year | Tax Paid | Tax Assessment Tax Assessment Total Assessment is a certain percentage of the fair market value that is determined by local assessors to be the total taxable value of land and additions on the property. | Land | Improvement |
|---|---|---|---|---|
| 2025 | $9,937 | $751,700 | $315,400 | $436,300 |
| 2024 | $9,348 | $691,900 | $289,100 | $402,800 |
| 2023 | $8,979 | $631,900 | $275,500 | $356,400 |
| 2022 | $8,632 | $594,500 | $257,200 | $337,300 |
| 2021 | $8,564 | $581,000 | $250,700 | $330,300 |
| 2020 | $8,306 | $570,100 | $250,700 | $319,400 |
| 2019 | $8,436 | $573,900 | $269,700 | $304,200 |
| 2018 | $8,391 | $575,900 | $280,100 | $295,800 |
| 2017 | $8,237 | $547,700 | $271,400 | $276,300 |
| 2016 | $8,136 | $549,000 | $266,700 | $282,300 |
| 2015 | $7,747 | $510,000 | $213,400 | $296,600 |
| 2014 | $7,559 | $504,300 | $213,400 | $290,900 |
Source: Public Records
Map
Nearby Homes
- 406 South St
- 80 Mill St
- 16 Treasure Island Rd
- 450 West St
- 356 Central St
- 12 Spring St
- 24 Maverick Dr
- 9 Oak Dr
- 483 Thurston St
- 166 Chauncy St
- 120 Hawes St
- 4 Buckskin Dr
- 14 Baker St
- 11 W Belcher Rd Unit 2
- 11 Orchard Place Unit 11
- 24 Mechanic St
- 84 Cocasset St Unit A6
- 231 Spring St
- 18 Winter St Unit E
- 28 Angell St