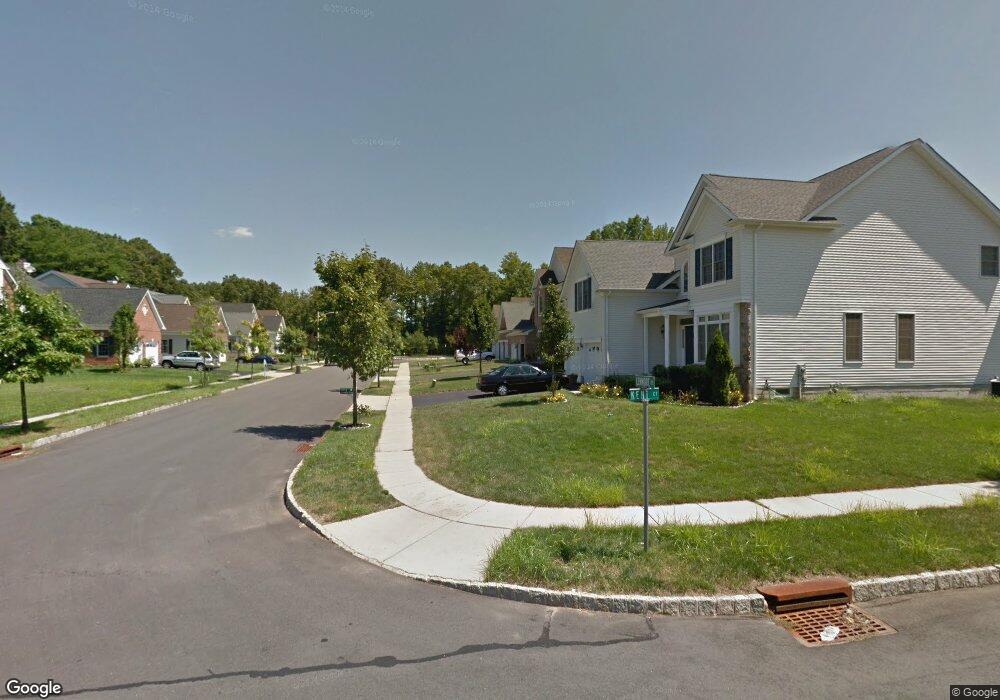
9 Kent Ct Princeton, NJ 08540
Estimated Value: $193,000 - $270,000
--
Bed
--
Bath
1,412
Sq Ft
$165/Sq Ft
Est. Value
About This Home
This home is located at 9 Kent Ct, Princeton, NJ 08540 and is currently estimated at $233,000, approximately $165 per square foot. 9 Kent Ct is a home located in Mercer County with nearby schools including Maurice Hawk Elementary School, Millstone River School, and Community Middle School.
Ownership History
Date
Name
Owned For
Owner Type
Purchase Details
Closed on
Feb 25, 2020
Sold by
Rastogi Rashmi
Bought by
Squarefoot Holdings Llc
Current Estimated Value
Purchase Details
Closed on
Sep 5, 2013
Sold by
Tradevision Llc
Bought by
Rastogi Rashmi
Home Financials for this Owner
Home Financials are based on the most recent Mortgage that was taken out on this home.
Original Mortgage
$50,000
Interest Rate
4.34%
Mortgage Type
New Conventional
Purchase Details
Closed on
Oct 13, 2006
Sold by
Yem Hocun
Bought by
Trade Vision Llc
Purchase Details
Closed on
Jul 2, 1998
Sold by
Gallo Anastasia
Bought by
Yem Hoeun and Chum Korn
Home Financials for this Owner
Home Financials are based on the most recent Mortgage that was taken out on this home.
Original Mortgage
$38,000
Interest Rate
6.94%
Create a Home Valuation Report for This Property
The Home Valuation Report is an in-depth analysis detailing your home's value as well as a comparison with similar homes in the area
Home Values in the Area
Average Home Value in this Area
Purchase History
| Date | Buyer | Sale Price | Title Company |
|---|---|---|---|
| Squarefoot Holdings Llc | -- | None Available | |
| Rastogi Rashmi | $62,500 | Wfg National Title Insu Co | |
| Trade Vision Llc | $51,581 | -- | |
| Yem Hoeun | $40,000 | -- |
Source: Public Records
Mortgage History
| Date | Status | Borrower | Loan Amount |
|---|---|---|---|
| Previous Owner | Rastogi Rashmi | $50,000 | |
| Previous Owner | Yem Hoeun | $38,000 |
Source: Public Records
Tax History Compared to Growth
Tax History
| Year | Tax Paid | Tax Assessment Tax Assessment Total Assessment is a certain percentage of the fair market value that is determined by local assessors to be the total taxable value of land and additions on the property. | Land | Improvement |
|---|---|---|---|---|
| 2025 | $3,428 | $59,100 | $11,200 | $47,900 |
| 2024 | $3,290 | $59,100 | $11,200 | $47,900 |
| 2023 | $3,290 | $59,100 | $11,200 | $47,900 |
| 2022 | $3,226 | $59,100 | $11,200 | $47,900 |
| 2021 | $3,282 | $59,100 | $11,200 | $47,900 |
| 2020 | $3,271 | $59,100 | $11,200 | $47,900 |
| 2019 | $3,219 | $59,100 | $11,200 | $47,900 |
| 2018 | $3,081 | $59,100 | $11,200 | $47,900 |
| 2017 | $2,928 | $59,100 | $11,200 | $47,900 |
| 2016 | $3,601 | $62,600 | $18,000 | $44,600 |
| 2015 | $3,589 | $62,600 | $18,000 | $44,600 |
| 2014 | $4,017 | $70,400 | $18,000 | $52,400 |
Source: Public Records
Map
Nearby Homes