Estimated Value: $278,957 - $315,000
Studio
2
Baths
2,319
Sq Ft
$128/Sq Ft
Est. Value
About This Home
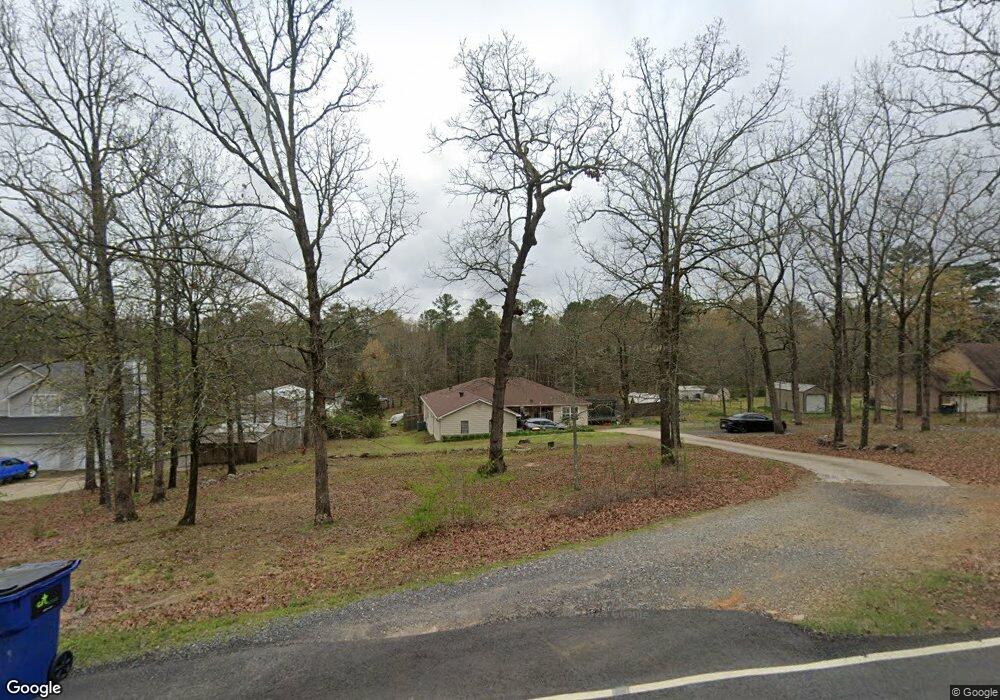
This home is located at 9 Kirkland Dr, Cabot, AR 72023 and is currently estimated at $297,489, approximately $128 per square foot. 9 Kirkland Dr is a home located in Lonoke County with nearby schools including Magness Creek Elementary School, Cabot Junior High North, and Cabot Middle School North.
Ownership History
Date
Name
Owned For
Owner Type
Purchase Details
Closed on
Mar 22, 2002
Bought by
Whitlock
Current Estimated Value
Purchase Details
Closed on
Dec 3, 2001
Bought by
Federal National Mort
Purchase Details
Closed on
Oct 15, 2001
Bought by
Homeside Lending
Purchase Details
Closed on
Apr 1, 1996
Bought by
Barr and Barr Wife
Purchase Details
Closed on
Nov 8, 1995
Bought by
Gaebel
Create a Home Valuation Report for This Property
The Home Valuation Report is an in-depth analysis detailing your home's value as well as a comparison with similar homes in the area
Purchase History
| Date | Buyer | Sale Price | Title Company |
|---|---|---|---|
| Whitlock | $42,000 | -- | |
| Whitlock | $42,000 | -- | |
| Federal National Mort | -- | -- | |
| Homeside Lending | -- | -- | |
| Barr | $115,000 | -- | |
| Gaebel | $11,000 | -- |
Source: Public Records
Tax History
| Year | Tax Paid | Tax Assessment Tax Assessment Total Assessment is a certain percentage of the fair market value that is determined by local assessors to be the total taxable value of land and additions on the property. | Land | Improvement |
|---|---|---|---|---|
| 2025 | $1,391 | $35,670 | $3,300 | $32,370 |
| 2024 | $1,391 | $35,670 | $3,300 | $32,370 |
| 2023 | $1,391 | $0 | $0 | $0 |
| 2022 | $1,441 | $35,670 | $3,300 | $32,370 |
| 2021 | $1,392 | $35,670 | $3,300 | $32,370 |
| 2020 | $1,308 | $33,060 | $3,300 | $29,760 |
| 2019 | $1,308 | $33,060 | $3,300 | $29,760 |
| 2018 | $1,006 | $27,450 | $3,300 | $24,150 |
| 2017 | $1,231 | $27,450 | $3,300 | $24,150 |
| 2016 | $974 | $27,450 | $3,300 | $24,150 |
| 2015 | $911 | $25,530 | $3,300 | $22,230 |
| 2014 | $911 | $25,530 | $3,300 | $22,230 |
Source: Public Records
Map
Nearby Homes
- Lot 14 Greystone Blvd
- 34 Kirkland Dr
- 18 Ridgecrest Ct
- 20 Ridgecrest Ct
- 00000 Greystone Blvd
- 39 Greystone Blvd
- 43 Greystone Blvd
- 44 Hickory Bend Dr
- 15 Hickory Bend Cir
- 21 Hickory Bend Dr
- 117 Ridgecrest Square
- 212 North Heights
- 250 N Heights
- 21 Clearwater Ln
- 0 Lakeland Dr Unit 24035574
- 17 Clearwater Ln
- 26 Lakeland Dr
- 16 Lakeland Dr
- 10 Valhalla Dr
- 409 Cobblestone Dr
- 7 Kirkland Dr
- 11 Kirkland Dr
- 13 Kirkland Dr
- 8 Kirkland Dr
- 6 Kirkland Dr
- 10 Kirkland Dr
- 3 Kirkland Dr
- 228 Spring Valley Rd
- 12 Kirkland Dr
- 186 Spring Valley Rd
- 15 Kirkland Dr
- 260 Spring Valley Rd
- 144 Spring Valley Rd
- 14 Kirkland Dr
- 2 Kirkland Dr
- 122 Spring Valley Rd
- 16 Kirkland Dr
- 80 Spring Valley Rd
- 0 Spring Valley Rd
- 332 Spring Valley Rd
Your Personal Tour Guide
Ask me questions while you tour the home.