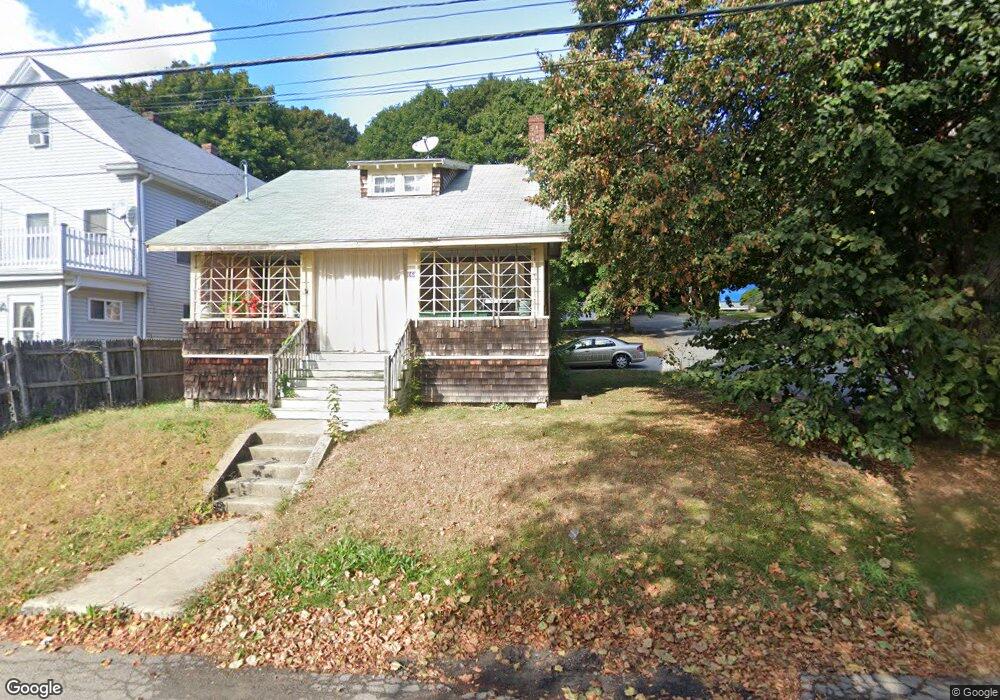
9 Lafayette Rd Hull, MA 02045
Telegraph Hill NeighborhoodEstimated Value: $464,000 - $562,882
2
Beds
3
Baths
1,320
Sq Ft
$378/Sq Ft
Est. Value
About This Home
This home is located at 9 Lafayette Rd, Hull, MA 02045 and is currently estimated at $498,971, approximately $378 per square foot. 9 Lafayette Rd is a home located in Plymouth County with nearby schools including Lillian M. Jacobs Elementary School, Hull High School, and Memorial Middle School.
Ownership History
Date
Name
Owned For
Owner Type
Purchase Details
Closed on
Jul 29, 2013
Sold by
Shiels Matthew R
Bought by
Shiels Leah D and Shiels Matthew R
Current Estimated Value
Purchase Details
Closed on
Jan 27, 2010
Sold by
Shiels Andrew
Bought by
Shiels Matthew R
Home Financials for this Owner
Home Financials are based on the most recent Mortgage that was taken out on this home.
Original Mortgage
$175,000
Interest Rate
4.95%
Mortgage Type
Purchase Money Mortgage
Purchase Details
Closed on
May 20, 2009
Sold by
Shiels Matthew R and Shiels Andrew R
Bought by
Shiels Matthew R and Shiels Andrew R
Purchase Details
Closed on
Jan 17, 1995
Sold by
Smith Christopher S and Hampton Smith W
Bought by
Shiels Nancy J
Purchase Details
Closed on
Jun 9, 1994
Sold by
Trabazan Nicholas
Bought by
Smith Christopher S and Smith Hampton W
Create a Home Valuation Report for This Property
The Home Valuation Report is an in-depth analysis detailing your home's value as well as a comparison with similar homes in the area
Home Values in the Area
Average Home Value in this Area
Purchase History
| Date | Buyer | Sale Price | Title Company |
|---|---|---|---|
| Shiels Leah D | -- | -- | |
| Shiels Matthew R | $125,000 | -- | |
| Shiels Matthew R | -- | -- | |
| Shiels Nancy J | $95,000 | -- | |
| Shiels Nancy J | $95,000 | -- | |
| Smith Christopher S | $22,000 | -- | |
| Smith Christopher S | $22,000 | -- |
Source: Public Records
Mortgage History
| Date | Status | Borrower | Loan Amount |
|---|---|---|---|
| Previous Owner | Smith Christopher S | $50,000 | |
| Previous Owner | Shiels Matthew R | $175,000 | |
| Previous Owner | Smith Christopher S | $100,000 |
Source: Public Records
Tax History Compared to Growth
Tax History
| Year | Tax Paid | Tax Assessment Tax Assessment Total Assessment is a certain percentage of the fair market value that is determined by local assessors to be the total taxable value of land and additions on the property. | Land | Improvement |
|---|---|---|---|---|
| 2025 | $4,952 | $442,100 | $184,900 | $257,200 |
| 2024 | $4,364 | $374,600 | $179,200 | $195,400 |
| 2023 | $4,334 | $356,100 | $173,400 | $182,700 |
| 2022 | $3,973 | $316,800 | $161,800 | $155,000 |
| 2021 | $3,724 | $293,700 | $144,500 | $149,200 |
| 2020 | $3,619 | $282,300 | $144,500 | $137,800 |
| 2019 | $4,459 | $268,500 | $138,700 | $129,800 |
| 2018 | $3,441 | $256,400 | $138,700 | $117,700 |
| 2017 | $3,408 | $248,400 | $138,700 | $109,700 |
| 2016 | $3,193 | $236,900 | $127,200 | $109,700 |
| 2015 | $3,141 | $225,300 | $115,600 | $109,700 |
| 2014 | $3,125 | $225,300 | $115,600 | $109,700 |
Source: Public Records
Map
Nearby Homes