K
Seller's Agent in 2025
Kathleen Emde
Realty One Group Freedom
(843) 718-7379
1 in this area
9 Total Sales
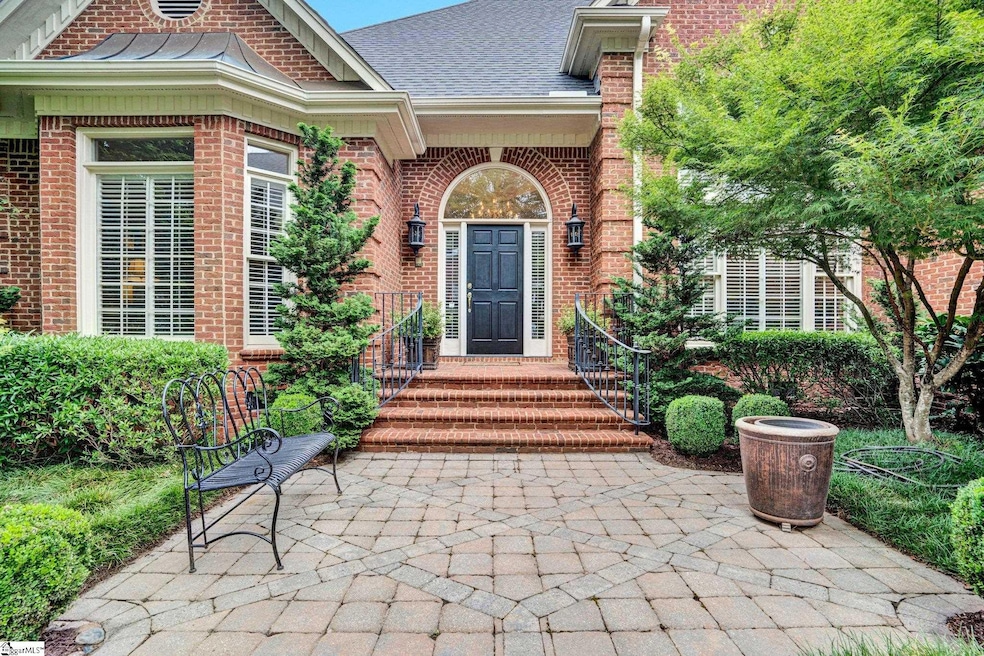
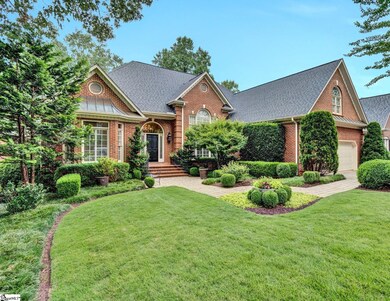
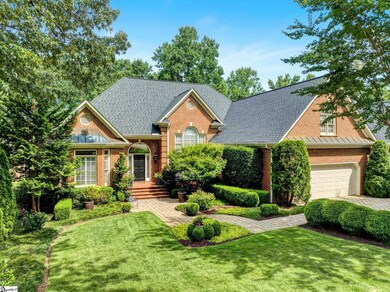

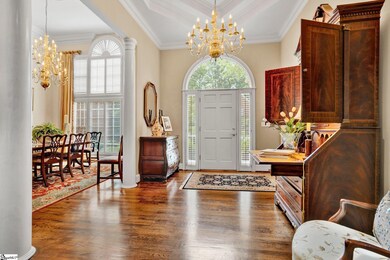
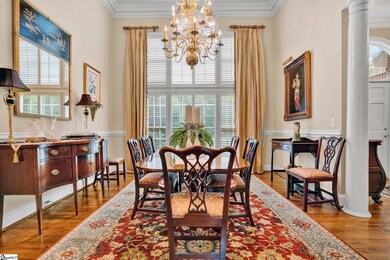
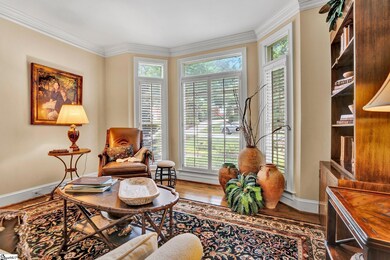
Elegant all Brick home on Thornblade Golf Course in the highly sought after Eastside location. Situated on the 2nd hole of the prestigious Thornblade golf course, this 3 bedroom, 2 bath all brick home offers a rare blend of classic architecture, refined interiors and exquisite outdoor living. Step inside to soaring trey and vaulted ceilings, creating a spacious light filled ambiance throughout. The highlight of the home is the elegant French Country kitchen, beautifully remodeled with upscale stainless-steel appliances, custom cabinetry, stone countertops and timeless finishes. Perfectly blending old-world charm with modern functionality. A large spacious bonus room with skylights, provides versatile space for a home office, media room or guest suite. Outdoors the attention to detail is unmatched. The paver driveway and sidewalk lead to lush professionally designed areas designed by Landscape Designer Graham Kimak. The backyard also houses a beautiful pergola and sitting areas to allow an ideal setting for both relaxation and entertaining. Weekly lawn maintenance for all Thornblade Gardens homes makes it one of the prettiest streets in Thornblade. New roof per owner in 2018. Kitchen and Laundry room remodeled in 2011. Primary Bath Remodeled in 2015. This exceptional property combines traditional charm, luxury upgrades, and an unmatched location in one of the upstates most desirable golf courses.
Last Agent to Sell the Property
Realty One Group Freedom License #9342 Listed on: 07/19/2025

| Date | Type | Sale Price | Title Company |
|---|---|---|---|
| Deed | $943,500 | None Listed On Document | |
| Quit Claim Deed | -- | None Listed On Document | |
| Limited Warranty Deed | -- | None Available | |
| Deed | $475,000 | -- |
| Date | Status | Loan Amount | Loan Type |
|---|---|---|---|
| Open | $754,800 | New Conventional | |
| Previous Owner | $1,000,000 | Credit Line Revolving | |
| Previous Owner | $300,000 | New Conventional |
| Date | Event | Price | List to Sale | Price per Sq Ft |
|---|---|---|---|---|
| 09/30/2025 09/30/25 | Sold | $943,500 | -0.7% | $295 / Sq Ft |
| 07/22/2025 07/22/25 | Pending | -- | -- | -- |
| 07/19/2025 07/19/25 | For Sale | $950,500 | -- | $297 / Sq Ft |
| Year | Tax Paid | Tax Assessment Tax Assessment Total Assessment is a certain percentage of the fair market value that is determined by local assessors to be the total taxable value of land and additions on the property. | Land | Improvement |
|---|---|---|---|---|
| 2024 | $2,519 | $17,900 | $4,200 | $13,700 |
| 2023 | $2,519 | $17,900 | $4,200 | $13,700 |
| 2022 | $2,325 | $17,900 | $4,200 | $13,700 |
| 2021 | $2,326 | $17,900 | $4,200 | $13,700 |
| 2020 | $2,429 | $17,690 | $3,780 | $13,910 |
| 2019 | $2,380 | $17,690 | $3,780 | $13,910 |
| 2018 | $2,526 | $17,690 | $3,780 | $13,910 |
| 2017 | $2,502 | $17,690 | $3,780 | $13,910 |
| 2016 | $2,685 | $442,270 | $94,530 | $347,740 |
| 2015 | $2,650 | $442,270 | $94,530 | $347,740 |
| 2014 | $2,818 | $473,300 | $110,400 | $362,900 |
K
Seller's Agent in 2025
Kathleen Emde
Realty One Group Freedom
(843) 718-7379
1 in this area
9 Total Sales
K
Buyer's Agent in 2025
Kenneth Cosgrove
Carolina Moves, LLC
(864) 907-3126
2 in this area
18 Total Sales
Source: Greater Greenville Association of REALTORS®
MLS Number: 1563875
APN: 0534.26-01-004.00
Disclaimer: Certain information contained herein is derived from information provided by parties other than Homes.com. All information provided is deemed reliable, but is not guaranteed to be accurate and should be independently verified.
![]() IDX information is provided exclusively for personal, non-commercial use, and may not be used for any purpose other than to identify prospective properties consumers may be interested in purchasing. Information is deemed reliable but not guaranteed.
IDX information is provided exclusively for personal, non-commercial use, and may not be used for any purpose other than to identify prospective properties consumers may be interested in purchasing. Information is deemed reliable but not guaranteed.