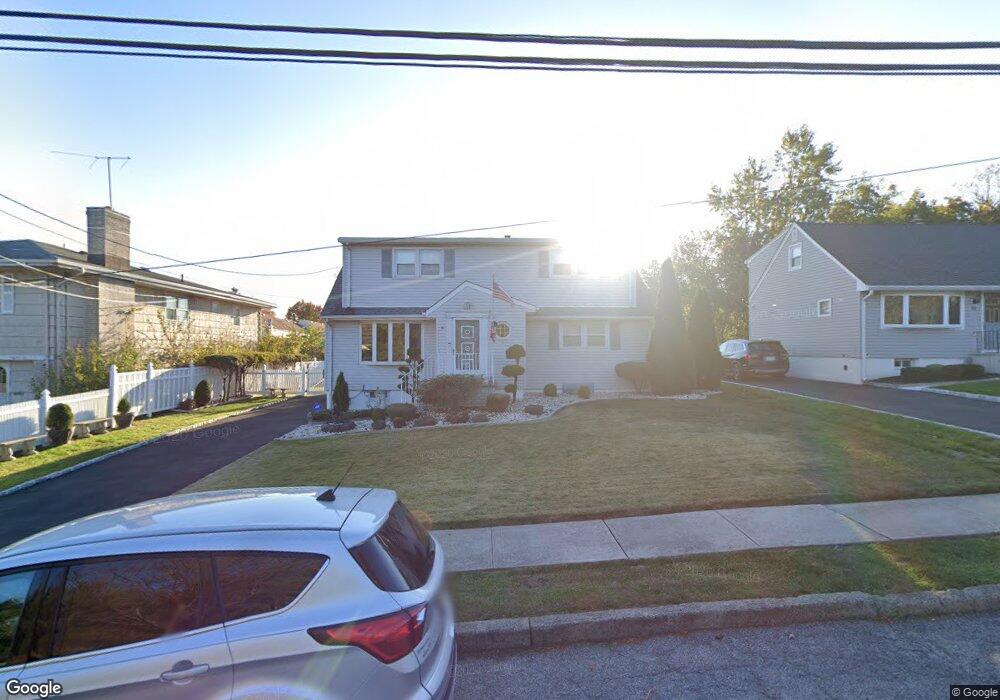
9 Lawrence Ct Clifton, NJ 07013
Richfield NeighborhoodEstimated Value: $660,000 - $672,030
Studio
--
Bath
1,552
Sq Ft
$431/Sq Ft
Est. Value
About This Home
This home is located at 9 Lawrence Ct, Clifton, NJ 07013 and is currently estimated at $668,508, approximately $430 per square foot. 9 Lawrence Ct is a home located in Passaic County with nearby schools including Clifton High School and Noble Leadership Academy.
Ownership History
Date
Name
Owned For
Owner Type
Purchase Details
Closed on
Aug 24, 2012
Current Estimated Value
Home Financials for this Owner
Home Financials are based on the most recent Mortgage that was taken out on this home.
Original Mortgage
$267,000
Outstanding Balance
$181,434
Interest Rate
3.57%
Mortgage Type
New Conventional
Estimated Equity
$487,074
Purchase Details
Closed on
May 19, 2010
Sold by
Danielovich Richard S and Danielovich Elaine
Home Financials for this Owner
Home Financials are based on the most recent Mortgage that was taken out on this home.
Original Mortgage
$270,000
Interest Rate
5.12%
Mortgage Type
Purchase Money Mortgage
Create a Home Valuation Report for This Property
The Home Valuation Report is an in-depth analysis detailing your home's value as well as a comparison with similar homes in the area
Home Values in the Area
Average Home Value in this Area
Purchase History
| Date | Buyer | Sale Price | Title Company |
|---|---|---|---|
| -- | -- | None Available | |
| -- | $370,000 | -- |
Source: Public Records
Mortgage History
| Date | Status | Borrower | Loan Amount |
|---|---|---|---|
| Open | -- | $267,000 | |
| Previous Owner | -- | $270,000 |
Source: Public Records
Tax History
| Year | Tax Paid | Tax Assessment Tax Assessment Total Assessment is a certain percentage of the fair market value that is determined by local assessors to be the total taxable value of land and additions on the property. | Land | Improvement |
|---|---|---|---|---|
| 2025 | $10,774 | $181,500 | $93,100 | $88,400 |
| 2024 | $10,516 | $181,500 | $93,100 | $88,400 |
| 2022 | $10,364 | $181,500 | $93,100 | $88,400 |
| 2021 | $9,937 | $181,500 | $93,100 | $88,400 |
| 2020 | $9,970 | $181,500 | $93,100 | $88,400 |
| 2019 | $9,899 | $181,500 | $93,100 | $88,400 |
| 2018 | $9,843 | $181,500 | $93,100 | $88,400 |
| 2017 | $9,736 | $181,500 | $93,100 | $88,400 |
| 2016 | $9,547 | $181,500 | $93,100 | $88,400 |
| 2015 | $9,454 | $181,500 | $93,100 | $88,400 |
| 2014 | $9,260 | $181,500 | $93,100 | $88,400 |
Source: Public Records
Map
Nearby Homes
- 15 Saint Michaels Place
- 32 Greendale Rd
- 102 Barnsdale Rd
- 415 Mount Prospect Ave
- 34 Chanda Ct
- 34 Chanda Ct Unit D034
- 35 Chanda Ct Unit D035
- 35 Chanda Ct
- 37 Chanda Ct
- 37 Chanda Ct Unit D037
- 40 Chanda Ct Unit D040
- 40 Chanda Ct
- 18 Roy Ct
- 31 Barnsdale Rd
- 585 Mount Prospect Ave
- 7 Chaplin Ct
- 108 Harrington Rd
- 33 Graydon Terrace
- 77 Macarthur Dr
- 43 Graydon Terrace
Your Personal Tour Guide
Ask me questions while you tour the home.