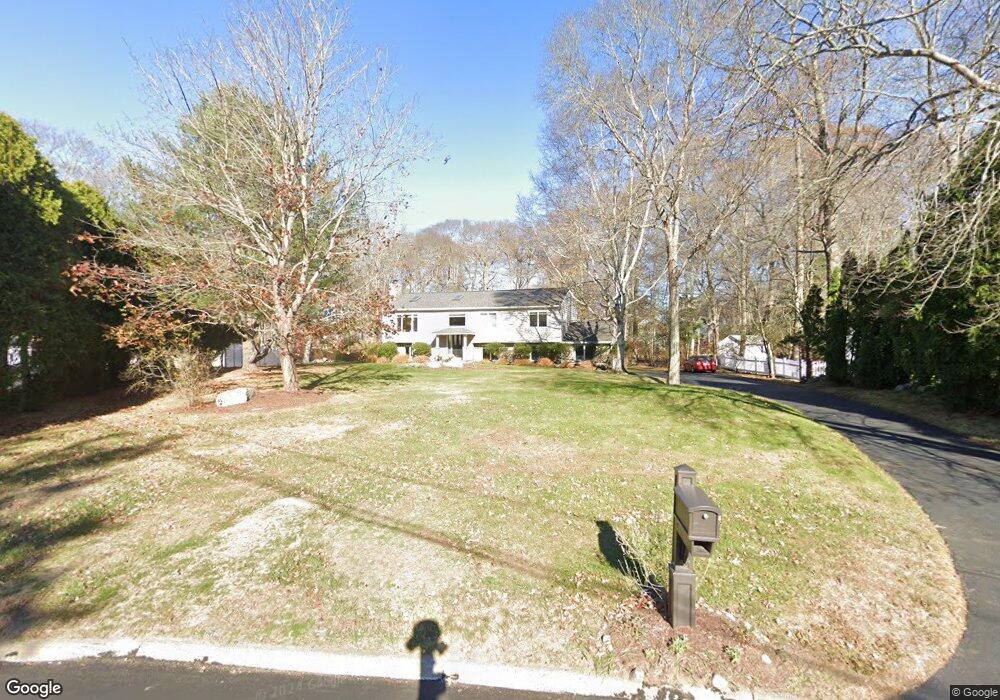
9 Leary Dr Waterford, CT 06385
Estimated Value: $488,000 - $506,537
3
Beds
2
Baths
1,248
Sq Ft
$398/Sq Ft
Est. Value
About This Home
This home is located at 9 Leary Dr, Waterford, CT 06385 and is currently estimated at $496,884, approximately $398 per square foot. 9 Leary Dr is a home located in New London County with nearby schools including Clark Lane Middle School, Waterford High School, and Torah Tots Early Childhood Center.
Ownership History
Date
Name
Owned For
Owner Type
Purchase Details
Closed on
Aug 26, 2005
Sold by
Mccutcheon Bruce and Mccutcheon Regina
Bought by
Morrison David and Morrison Susan
Current Estimated Value
Home Financials for this Owner
Home Financials are based on the most recent Mortgage that was taken out on this home.
Original Mortgage
$80,000
Outstanding Balance
$42,342
Interest Rate
5.68%
Mortgage Type
Purchase Money Mortgage
Estimated Equity
$454,542
Create a Home Valuation Report for This Property
The Home Valuation Report is an in-depth analysis detailing your home's value as well as a comparison with similar homes in the area
Home Values in the Area
Average Home Value in this Area
Purchase History
| Date | Buyer | Sale Price | Title Company |
|---|---|---|---|
| Morrison David | $320,000 | -- |
Source: Public Records
Mortgage History
| Date | Status | Borrower | Loan Amount |
|---|---|---|---|
| Open | Morrison David | $80,000 | |
| Previous Owner | Morrison David | $121,500 | |
| Previous Owner | Morrison David | $10,000 | |
| Previous Owner | Morrison David | $135,900 |
Source: Public Records
Tax History Compared to Growth
Tax History
| Year | Tax Paid | Tax Assessment Tax Assessment Total Assessment is a certain percentage of the fair market value that is determined by local assessors to be the total taxable value of land and additions on the property. | Land | Improvement |
|---|---|---|---|---|
| 2025 | $7,035 | $301,150 | $122,830 | $178,320 |
| 2024 | $6,716 | $301,150 | $122,830 | $178,320 |
| 2023 | $6,384 | $301,150 | $122,830 | $178,320 |
| 2022 | $5,874 | $213,120 | $91,430 | $121,690 |
| 2021 | $5,891 | $213,120 | $91,430 | $121,690 |
| 2020 | $5,940 | $213,120 | $91,430 | $121,690 |
| 2019 | $5,963 | $213,120 | $91,430 | $121,690 |
| 2018 | $5,844 | $213,120 | $91,430 | $121,690 |
| 2017 | $5,639 | $208,610 | $81,970 | $126,640 |
| 2016 | $5,587 | $208,610 | $81,970 | $126,640 |
| 2015 | $5,388 | $208,610 | $81,970 | $126,640 |
| 2014 | $5,388 | $208,610 | $81,970 | $126,640 |
Source: Public Records
Map
Nearby Homes
- 1 Spinnaker Rd
- 7 Nichols Ln
- 15A Shore Rd
- 25 Division St
- 212 Shore Rd
- 17 Westwood Dr
- 51 Braman Rd
- 18 Whaling Dr
- 23 Whaling Dr
- 2 Maginnis Pkwy
- 2 Forest St
- 12 Greenfield St
- 4 Ridgewood Ave
- 107 Niles Hill Rd Unit A
- 41 Niles Hill Rd
- 52B Millstone Rd W
- 57 Westridge Rd Unit B2
- 41 Stuart Ave
- 58 Millstone Rd W
- 14 Park St