9 Leo Dr Fairview Heights, IL 62208
Estimated Value: $89,487 - $136,000
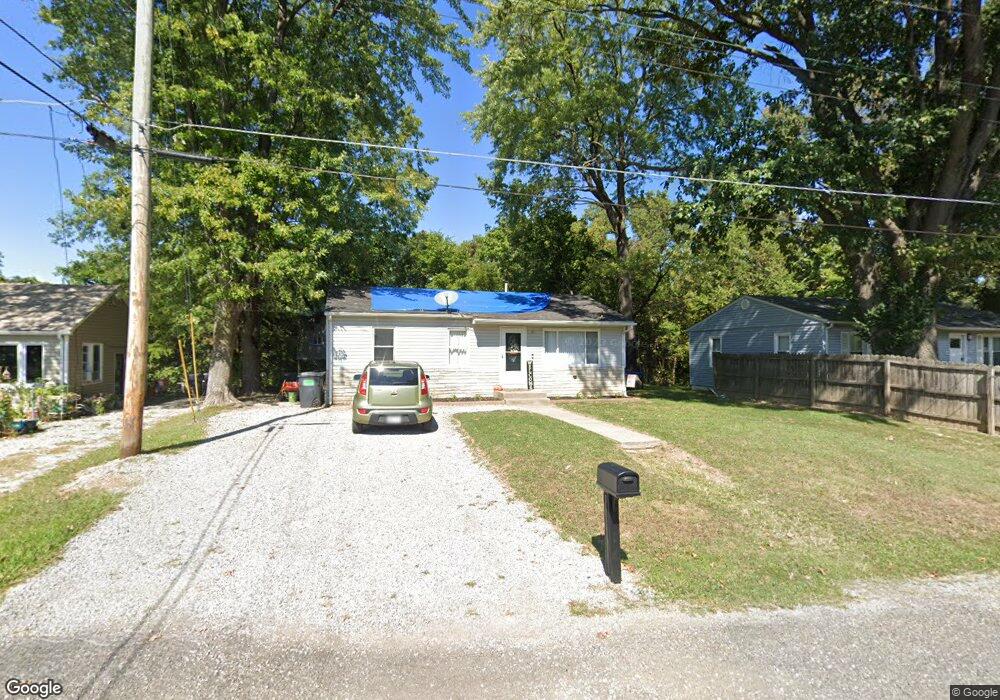
About This Home
This home is located at 9 Leo Dr, Fairview Heights, IL 62208 and is currently estimated at $110,372, approximately $131 per square foot. 9 Leo Dr is a home located in St. Clair County with nearby schools including Illini Elementary School, Grant Middle School, and Holy Trinity Catholic School.
Ownership History
We collect this data history from publicly available records. To have your information removed, we recommend requesting removal directly through your county’s website.
Purchase Details
Purchase Details
Purchase Details
Home Values in the Area
Average Home Value in this Area
Purchase History
We collect this data history from publicly available records. To have your information removed, we recommend requesting removal directly through your county’s website.
| Date | Buyer | Sale Price | Title Company |
|---|---|---|---|
| $5,000 | Professional T | ||
| -- | None Available | ||
| $5,000 | None Available |
Tax History
We collect this data history from publicly available records. To have your information removed, we recommend requesting removal directly through your county’s website.
| Year | Tax Paid | Tax Assessment Tax Assessment Total Assessment is a certain percentage of the fair market value that is determined by local assessors to be the total taxable value of land and additions on the property. | Land | Improvement |
|---|---|---|---|---|
| 2024 | $1,945 | $24,644 | $4,864 | $19,780 |
| 2023 | $1,849 | $21,805 | $4,304 | $17,501 |
| 2022 | $1,605 | $18,528 | $4,219 | $14,309 |
| 2021 | $1,532 | $17,585 | $4,004 | $13,581 |
| 2020 | $1,507 | $16,657 | $3,792 | $12,865 |
| 2019 | $1,456 | $16,657 | $3,792 | $12,865 |
| 2018 | $1,497 | $17,131 | $4,054 | $13,077 |
| 2017 | $1,465 | $16,436 | $3,890 | $12,546 |
| 2016 | $1,475 | $16,065 | $3,802 | $12,263 |
| 2014 | $1,710 | $21,118 | $3,384 | $17,734 |
| 2013 | $1,021 | $21,507 | $3,446 | $18,061 |
Map
- 10 Leo Dr
- 39 Potomac Dr
- 25 Roselawn Ave
- 2 Pasadena Dr
- 31 Judith Ln
- 26 Fairway Dr
- 2 Sheryl Dr
- 104 Primrose Ln
- 625 Pleasant Ridge Rd
- 334 Pleasant Ridge Rd
- 6 Kingston Dr
- 331 Liberty Rd
- 210 W School St
- 1145 Stonewolf Trail
- 1078 Blackwolf Ct
- 114 Ashland Ave
- 17 Joseph Dr
- 9409 Marbarry Dr
- 34 Wilshire Dr
- 9 Debra Dr
- 308 Roselawn Ave
- 310 Roselawn Ave
- 306 Roselawn Ave
- 312 Roselawn Ave
- 304 Roselawn Ave
- 14 Leo Dr
- 18 Leo Dr
- 302 Roselawn Ave
- 307 Roselawn Ave
- 309 Roselawn Ave
- 314 Roselawn Ave
- 311 Roselawn Ave
- 303 Roselawn Ave
- 300 Roselawn Ave
- 313 Roselawn Ave
- 20 Leo Dr
- 301 Roselawn Ave
- 23 Leo Dr
- 112 Mark Dr
- 25 Pine Trail
Ask me questions while you tour the home.