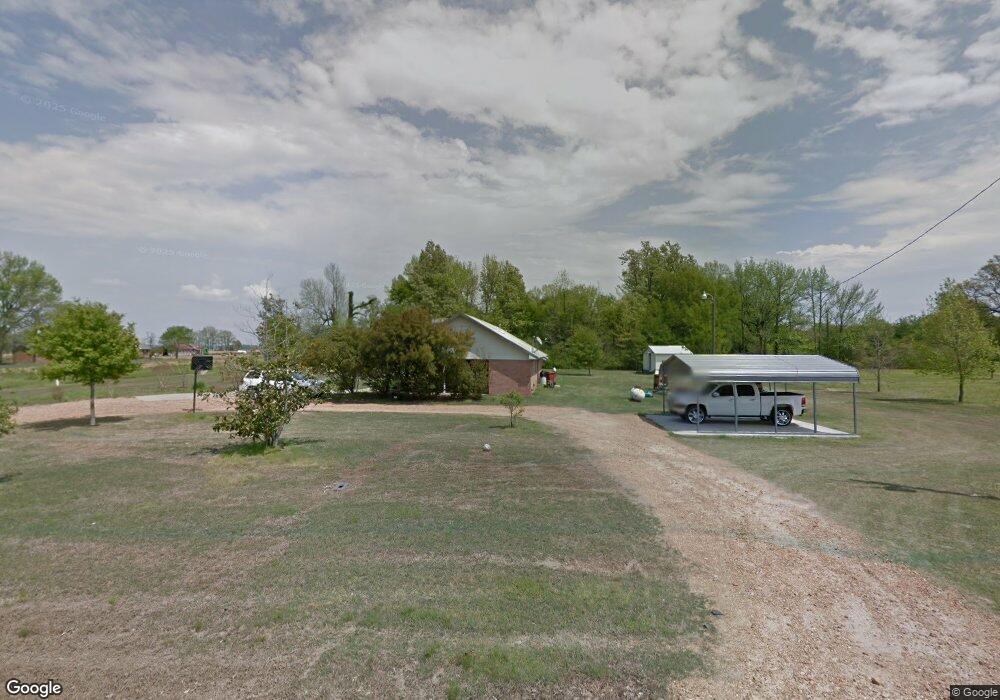
9 Lindley Ln Charleston, MS 38921
Estimated Value: $112,000 - $543,000
3
Beds
--
Bath
1,720
Sq Ft
$142/Sq Ft
Est. Value
About This Home
This home is located at 9 Lindley Ln, Charleston, MS 38921 and is currently estimated at $244,560, approximately $142 per square foot. 9 Lindley Ln is a home located in Tallahatchie County with nearby schools including Charleston Elementary School, Charleston Middle School, and Charleston High School.
Create a Home Valuation Report for This Property
The Home Valuation Report is an in-depth analysis detailing your home's value as well as a comparison with similar homes in the area
Tax History
| Year | Tax Paid | Tax Assessment Tax Assessment Total Assessment is a certain percentage of the fair market value that is determined by local assessors to be the total taxable value of land and additions on the property. | Land | Improvement |
|---|---|---|---|---|
| 2025 | $1,222 | $11,612 | $700 | $10,912 |
| 2024 | $939 | $9,292 | $700 | $8,592 |
| 2023 | $888 | $9,292 | $700 | $8,592 |
| 2022 | $797 | $8,800 | $700 | $8,100 |
| 2021 | $786 | $8,800 | $700 | $8,100 |
| 2020 | $760 | $8,512 | $700 | $7,812 |
| 2019 | $760 | $8,512 | $700 | $7,812 |
| 2018 | $730 | $8,512 | $700 | $7,812 |
| 2017 | $746 | $9,492 | $700 | $8,792 |
| 2016 | $746 | $8,841 | $700 | $8,141 |
| 2015 | -- | $8,841 | $700 | $8,141 |
| 2014 | -- | $8,841 | $700 | $8,141 |
| 2013 | -- | $9,242 | $700 | $8,542 |
Source: Public Records
Map
Nearby Homes
- 1325 Greenwood Dr
- 1325 Greenwood Ridge
- 209 N Franklin St
- 318 W Chestnut St
- 268 W Gay St
- 190 W Cypress St
- 145 Broome St
- 3081-3015 Shook Rd
- 1250 Friendship East Rd
- 175 Poplar Springs Rd Unit LotWP001
- 3491 Highway 32
- 3751 Friendship Rd E
- 173 Cascilla Road - Holcolmb - Tallahatchie County
- 173 Cascilla Rd
- 0 Dry Bayou Rd
- 6000 Teasdale Rd
- Back Rd
- 1183 William Adams Rd
- 1 Hampton Lake Rd
- 0 Lane Rd
- 5034 Ms Highway 32 Central
- 1078 Lindley Ln
- 5031 Ms Highway 32 Central
- 23172 Ms Highway 32
- 1208 Carroll Dr
- 4974 Ms Highway 32 Central
- 74 Lindley Ln
- 4975 Ms Highway 32 Central
- 4963 Ms Highway 32 Central
- 87 Silver Dr
- 20028 Ms Highway 35
- 1298 Carroll Dr
- 13918 Ms Highway 35
- 84 Lindley Ln
- 4920 Ms Highway 32 Central
- 4920 Ms Highway 32 Central
- 4929 Ms Highway 32 Central
- 4915 Ms Highway 32 Central
- 53 Bradford Dr
- 28 Lang Dr
Your Personal Tour Guide
Ask me questions while you tour the home.