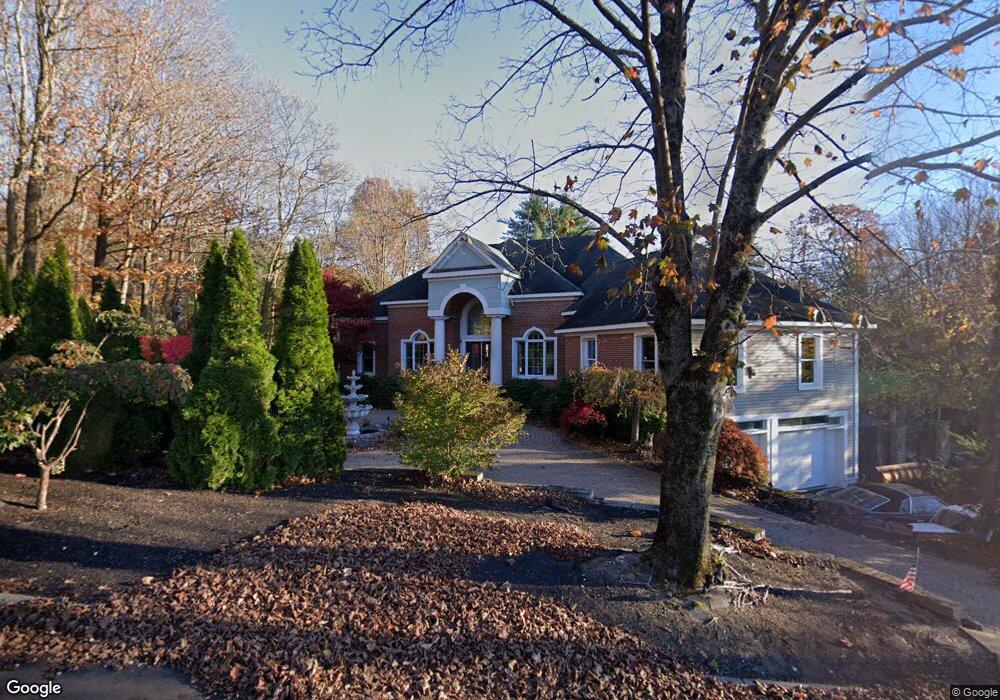
9 Locust Grove Rd Merrimac, MA 01860
Estimated Value: $1,309,034 - $1,595,000
4
Beds
4
Baths
4,430
Sq Ft
$333/Sq Ft
Est. Value
About This Home
This home is located at 9 Locust Grove Rd, Merrimac, MA 01860 and is currently estimated at $1,475,009, approximately $332 per square foot. 9 Locust Grove Rd is a home located in Essex County with nearby schools including Pentucket Regional High School.
Ownership History
Date
Name
Owned For
Owner Type
Purchase Details
Closed on
Nov 29, 2005
Sold by
Giroux Rt and Giroux Norman R
Bought by
Bragel Lynette L
Current Estimated Value
Home Financials for this Owner
Home Financials are based on the most recent Mortgage that was taken out on this home.
Original Mortgage
$575,000
Interest Rate
6.06%
Mortgage Type
Purchase Money Mortgage
Purchase Details
Closed on
Mar 11, 2003
Sold by
Giroux Rt and Giroux Norman R
Bought by
Giroux Karen J
Home Financials for this Owner
Home Financials are based on the most recent Mortgage that was taken out on this home.
Original Mortgage
$179,000
Interest Rate
5.95%
Mortgage Type
Purchase Money Mortgage
Purchase Details
Closed on
Dec 3, 1999
Sold by
Lamson Rt and Lamson Lawrence
Bought by
Giroux Karen and Giroux Karen J
Create a Home Valuation Report for This Property
The Home Valuation Report is an in-depth analysis detailing your home's value as well as a comparison with similar homes in the area
Home Values in the Area
Average Home Value in this Area
Purchase History
| Date | Buyer | Sale Price | Title Company |
|---|---|---|---|
| Bragel Lynette L | $975,000 | -- | |
| Giroux Karen J | -- | -- | |
| Giroux Karen | $120,000 | -- |
Source: Public Records
Mortgage History
| Date | Status | Borrower | Loan Amount |
|---|---|---|---|
| Open | Giroux Karen | $676,000 | |
| Closed | Giroux Karen | $575,000 | |
| Previous Owner | Giroux Karen | $200,000 | |
| Previous Owner | Giroux Karen | $179,000 |
Source: Public Records
Tax History Compared to Growth
Tax History
| Year | Tax Paid | Tax Assessment Tax Assessment Total Assessment is a certain percentage of the fair market value that is determined by local assessors to be the total taxable value of land and additions on the property. | Land | Improvement |
|---|---|---|---|---|
| 2025 | $16,657 | $1,257,100 | $397,800 | $859,300 |
| 2024 | $16,609 | $1,230,300 | $375,600 | $854,700 |
| 2023 | $15,492 | $1,048,900 | $345,100 | $703,800 |
| 2022 | $14,389 | $880,600 | $288,400 | $592,200 |
| 2021 | $13,715 | $841,400 | $249,200 | $592,200 |
| 2020 | $12,520 | $841,400 | $249,200 | $592,200 |
| 2019 | $12,969 | $820,300 | $249,200 | $571,100 |
| 2018 | $12,736 | $808,100 | $249,200 | $558,900 |
| 2017 | $12,477 | $763,600 | $223,100 | $540,500 |
| 2016 | $12,141 | $751,300 | $223,100 | $528,200 |
| 2015 | $11,765 | $724,000 | $240,500 | $483,500 |
| 2014 | $11,504 | $724,000 | $240,500 | $483,500 |
Source: Public Records
Map
Nearby Homes
- - Rr Locust Grove Rd
- 7 Locust Grove Rd
- 7 Locust Grove Rd
- 15 Colonial Dr
- 16 Colonial Dr
- 17 Colonial Dr
- 1 Colonial Dr
- 2 Colonial Dr
- 3 Colonial Dr
- 5 Locust Grove Rd
- 3 Locust Grove Rd
- 5 Colonial Dr
- 4 Colonial Dr
- 1 Locust Grove Rd
- 58 River Rd
- 54 River Rd
- 6 Colonial Dr
- 40 Locust St
- 42 River Rd
- 60 River Rd